 4
4peptides
spectra
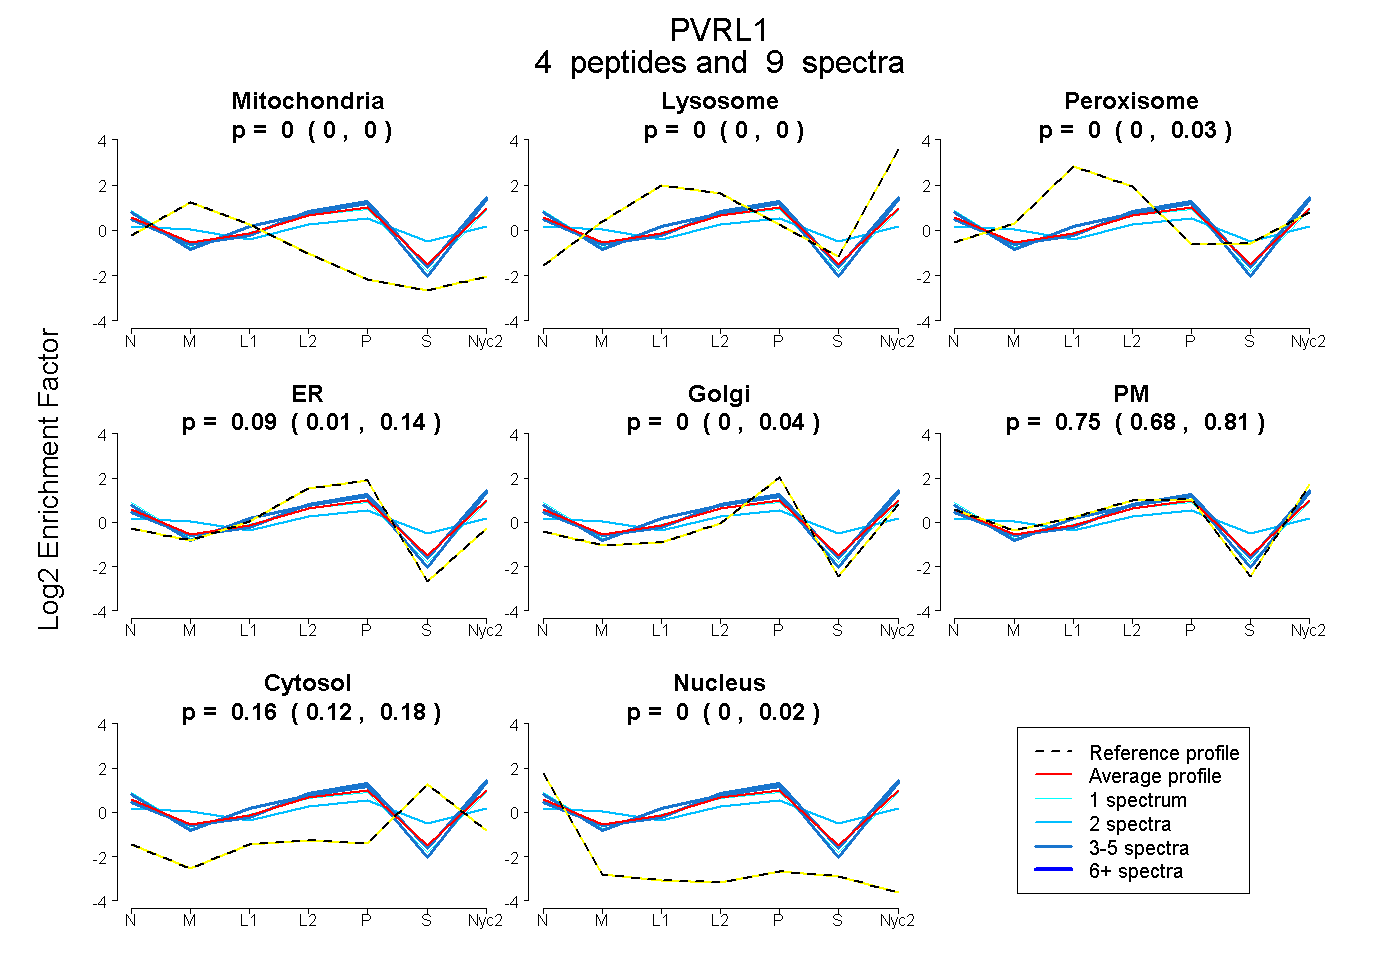
0.000 | 0.005
0.000 | 0.000
0.000 | 0.027
0.009 | 0.137
0.000 | 0.040
0.679 | 0.807
0.121 | 0.180
0.000 | 0.018
| Plot | Mito | Lyso | Perox | ER | Golgi | PM | Cytosol | Nucleus | |||||
| Expt A |
4 peptides |
9 spectra |
|
0.000 0.000 | 0.005 |
0.000 0.000 | 0.000 |
0.000 0.000 | 0.027 |
0.086 0.009 | 0.137 |
0.000 0.000 | 0.040 |
0.753 0.679 | 0.807 |
0.161 0.121 | 0.180 |
0.000 0.000 | 0.018 |
| 2 spectra, QSLACIVNYHLDR | 0.092 | 0.000 | 0.128 | 0.033 | 0.123 | 0.364 | 0.260 | 0.000 | ||
| 3 spectra, VGGPHPK | 0.000 | 0.000 | 0.000 | 0.034 | 0.028 | 0.870 | 0.056 | 0.013 | ||
| 1 spectrum, QDGYGDR | 0.000 | 0.000 | 0.004 | 0.073 | 0.000 | 0.780 | 0.084 | 0.060 | ||
| 3 spectra, VEFLRPSFIDGTIR | 0.000 | 0.000 | 0.000 | 0.000 | 0.123 | 0.782 | 0.095 | 0.000 |
| Plot | Lyso | Other | |||||||||||
| Expt C |
2 peptides |
6 spectra |
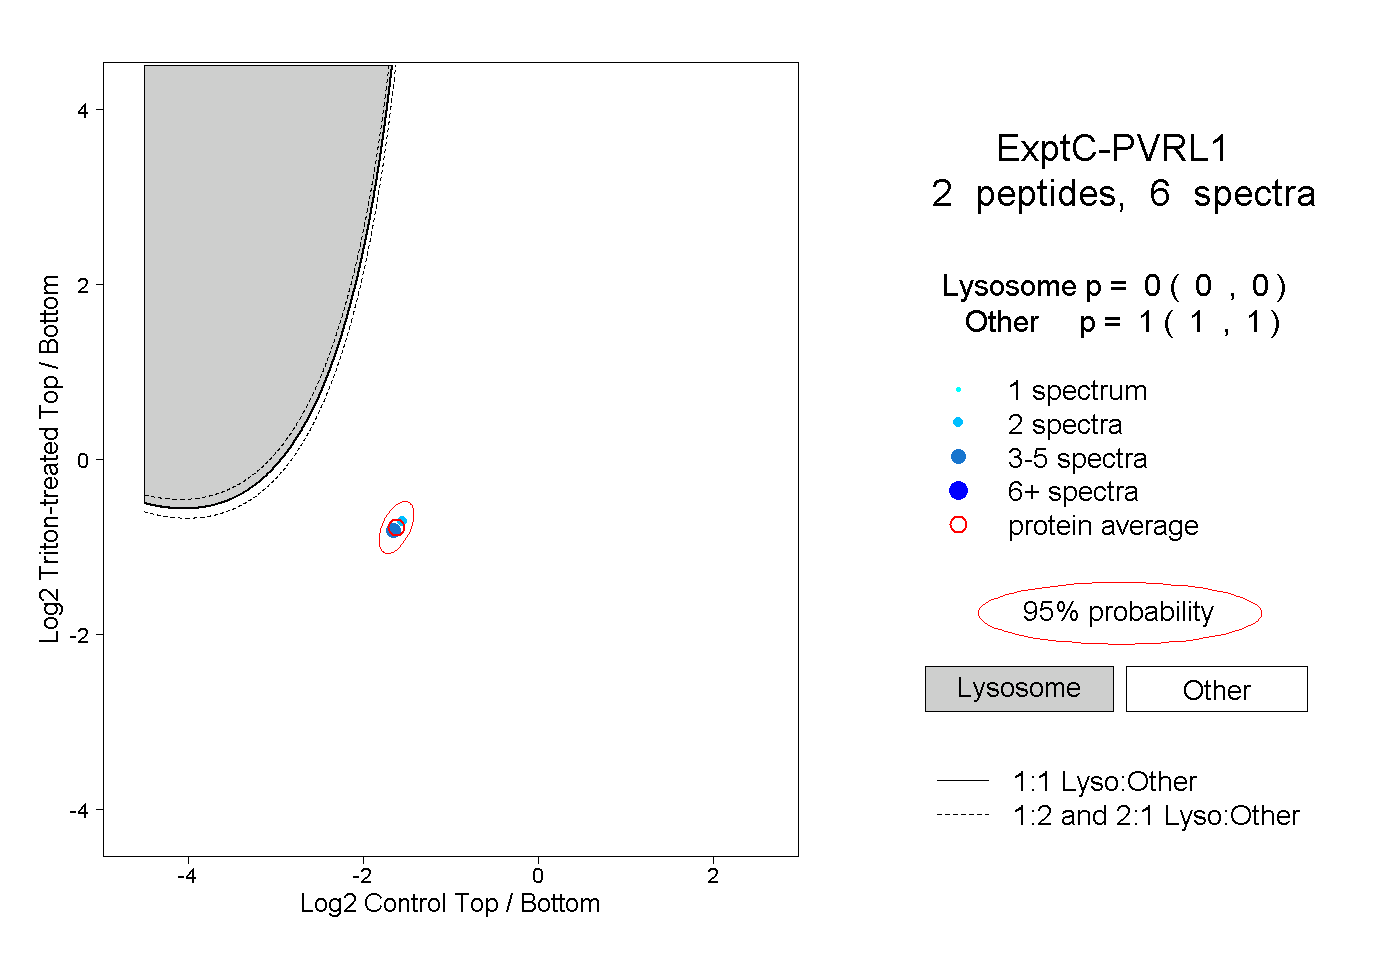 |
0.000 0.000 | 0.000 |
1.000 1.000 | 1.000 |