 12
12peptides
spectra
0.000 | 0.000
0.000 | 0.000
0.000 | 0.000
0.030 | 0.178
0.057 | 0.219
0.000 | 0.000
0.291 | 0.317
0.420 | 0.454
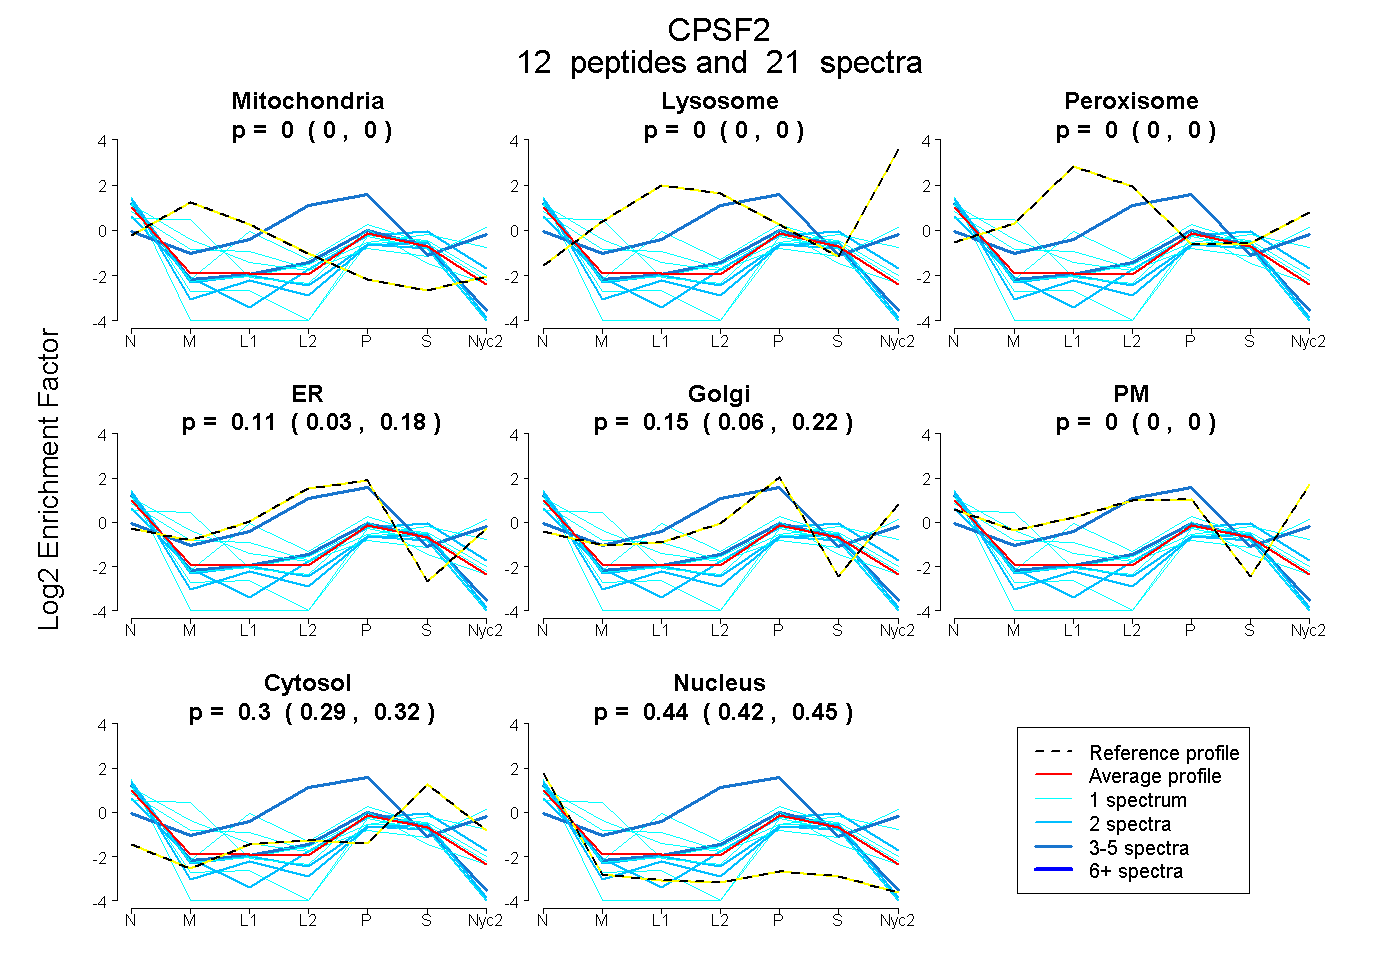
| Plot | Mito | Lyso | Perox | ER | Golgi | PM | Cytosol | Nucleus | |||||
| Expt A |
12 peptides |
21 spectra |
|
0.000 0.000 | 0.000 |
0.000 0.000 | 0.000 |
0.000 0.000 | 0.000 |
0.111 0.030 | 0.178 |
0.145 0.057 | 0.219 |
0.000 0.000 | 0.000 |
0.305 0.291 | 0.317 |
0.439 0.420 | 0.454 |
| 3 spectra, SDGDSIK | 0.000 | 0.000 | 0.000 | 0.686 | 0.000 | 0.093 | 0.221 | 0.000 | ||
| 1 spectrum, IGLEGCLCQDFYR | 0.129 | 0.000 | 0.000 | 0.000 | 0.000 | 0.280 | 0.413 | 0.178 | ||
| 1 spectrum, SQVEWMSDK | 0.341 | 0.000 | 0.000 | 0.000 | 0.276 | 0.000 | 0.065 | 0.317 | ||
| 2 spectra, DEQLLTNVLETLR | 0.000 | 0.000 | 0.000 | 0.000 | 0.188 | 0.000 | 0.447 | 0.365 | ||
| 5 spectra, ELEEYVEK | 0.000 | 0.000 | 0.000 | 0.244 | 0.000 | 0.000 | 0.246 | 0.509 | ||
| 1 spectrum, QLIIVHGPPEASQDLAECCR | 0.000 | 0.000 | 0.000 | 0.000 | 0.000 | 0.000 | 0.189 | 0.811 | ||
| 2 spectra, VVLASQPDLECGFSR | 0.000 | 0.000 | 0.000 | 0.009 | 0.000 | 0.000 | 0.334 | 0.657 | ||
| 1 spectrum, NSIILTYR | 0.107 | 0.000 | 0.000 | 0.000 | 0.000 | 0.422 | 0.212 | 0.259 | ||
| 1 spectrum, DAELAWIDGVLDMR | 0.000 | 0.000 | 0.000 | 0.000 | 0.000 | 0.000 | 0.309 | 0.691 | ||
| 2 spectra, NNPFQFR | 0.000 | 0.000 | 0.000 | 0.108 | 0.000 | 0.000 | 0.246 | 0.645 | ||
| 1 spectrum, TTPGTLAR | 0.000 | 0.000 | 0.000 | 0.115 | 0.135 | 0.000 | 0.349 | 0.401 | ||
| 1 spectrum, IINQMKPR | 0.000 | 0.000 | 0.138 | 0.270 | 0.000 | 0.000 | 0.248 | 0.344 |
| Plot | Mito | Lyso or Perox | ER | Golgi | PM | Cytosol | Nucleus | ||||||
| Expt B |
2 peptides |
2 spectra |
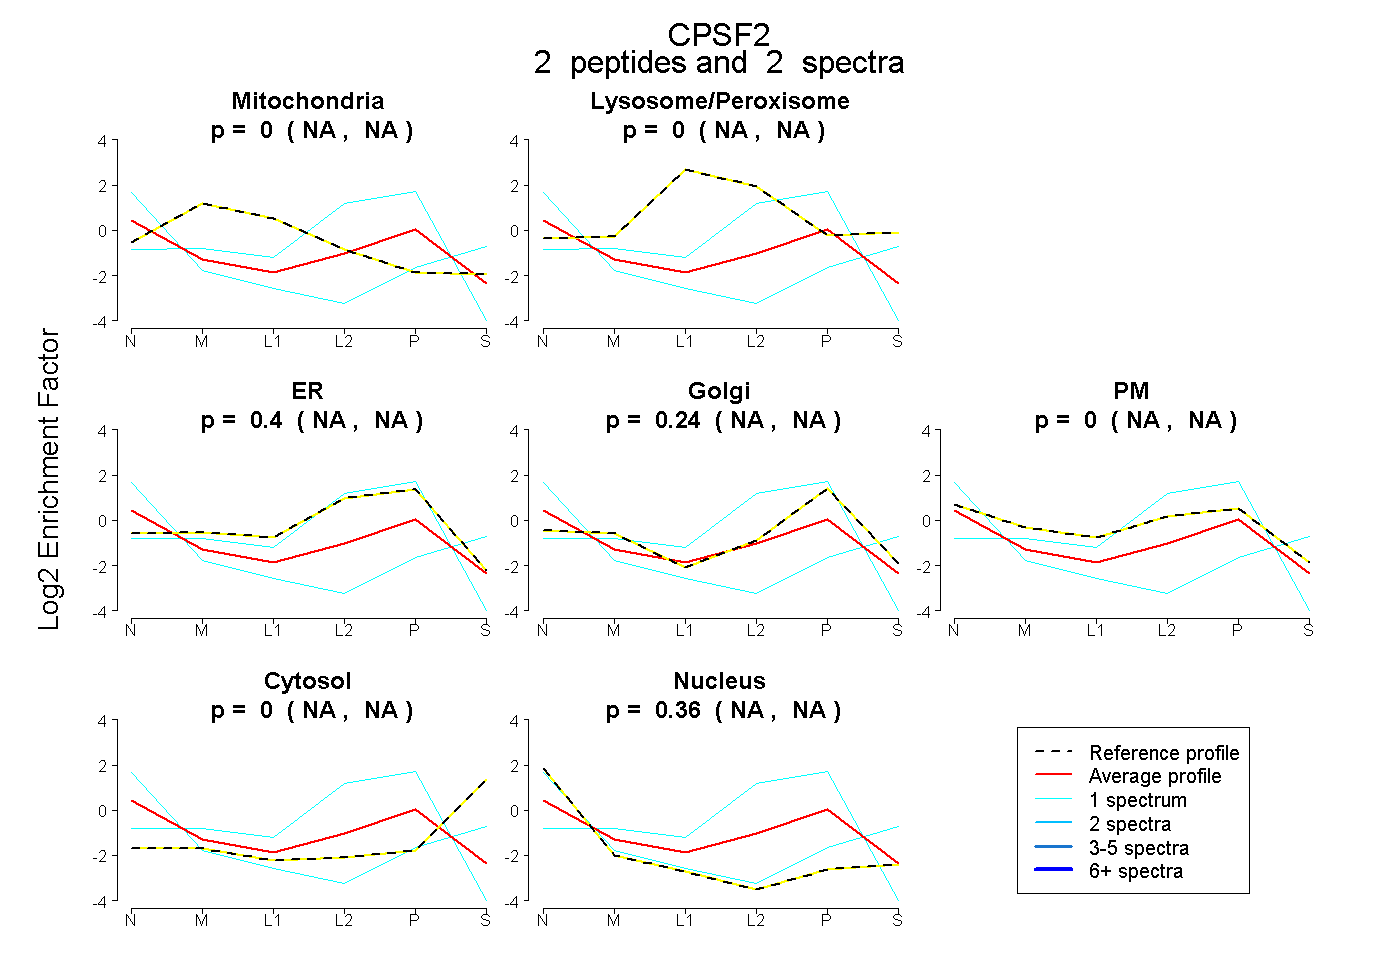 |
0.000 NA | NA |
0.000 NA | NA |
0.401 NA | NA |
0.236 NA | NA |
0.000 NA | NA |
0.000 NA | NA |
0.363 NA | NA |
|||
| Plot | Lyso | Other | |||||||||||
| Expt C |
1 peptide |
3 spectra |
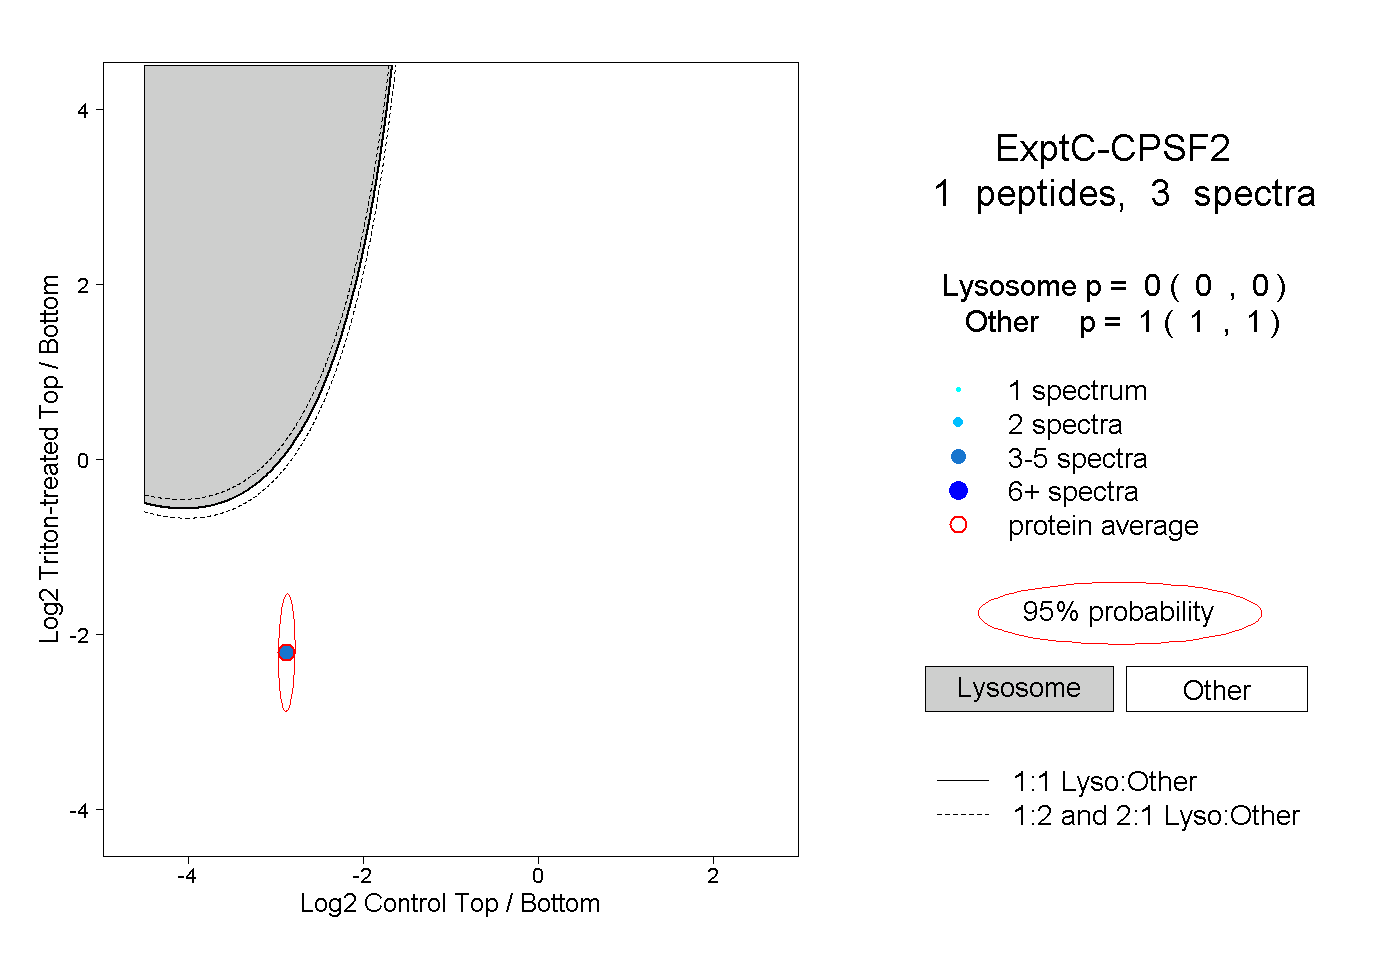 |
0.000 0.000 | 0.000 |
1.000 1.000 | 1.000 |
||||||||
| Plot | Lyso | Other | |||||||||||
| Expt D |
1 peptide |
2 spectra |
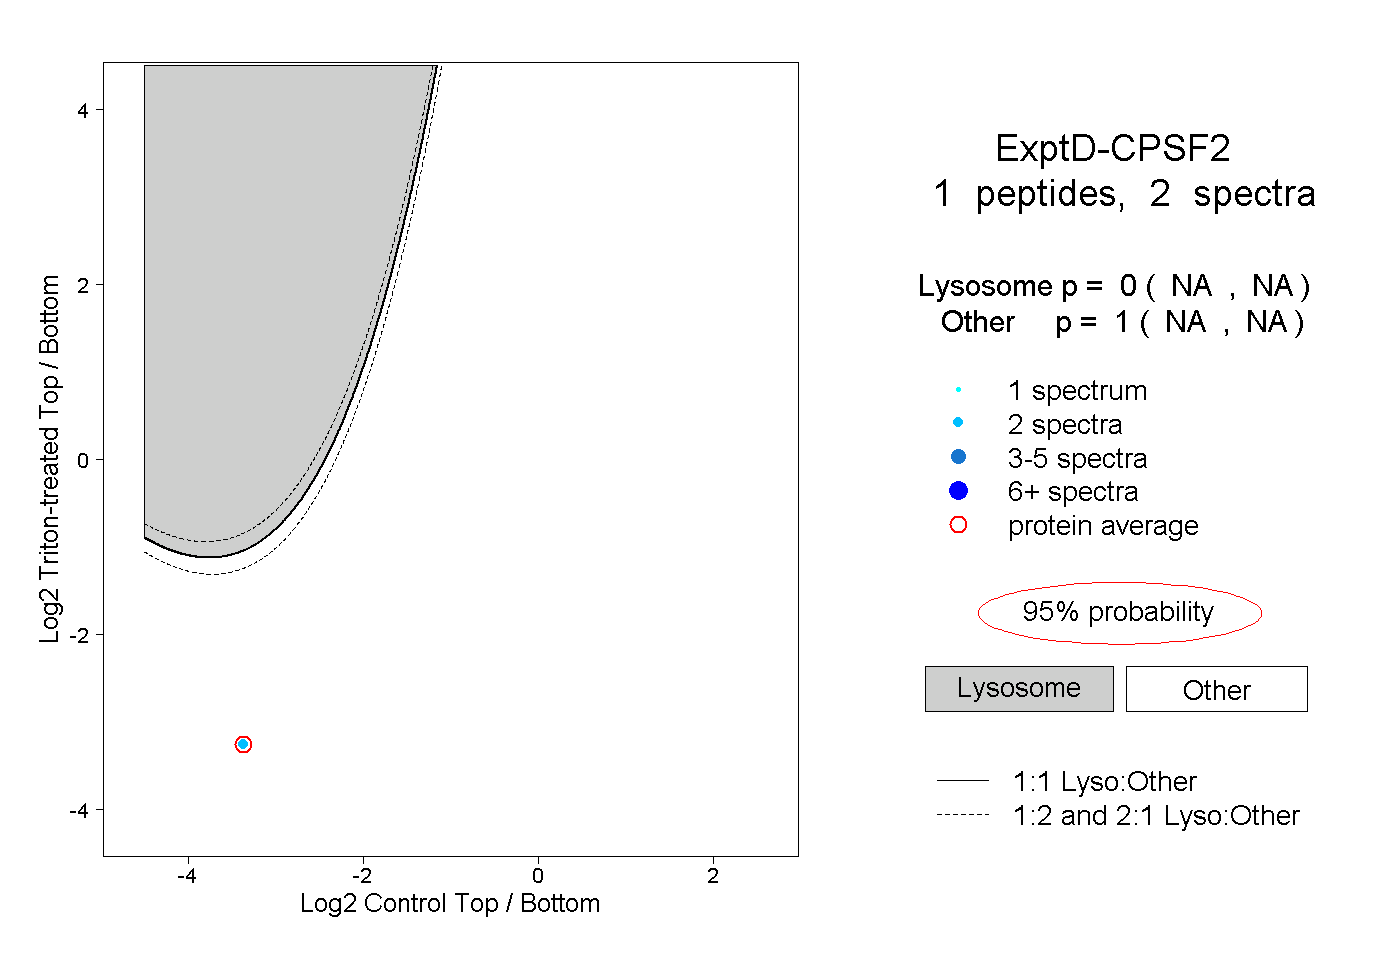 |
0.000 NA | NA |
1.000 NA | NA |