 3
3peptides
spectra
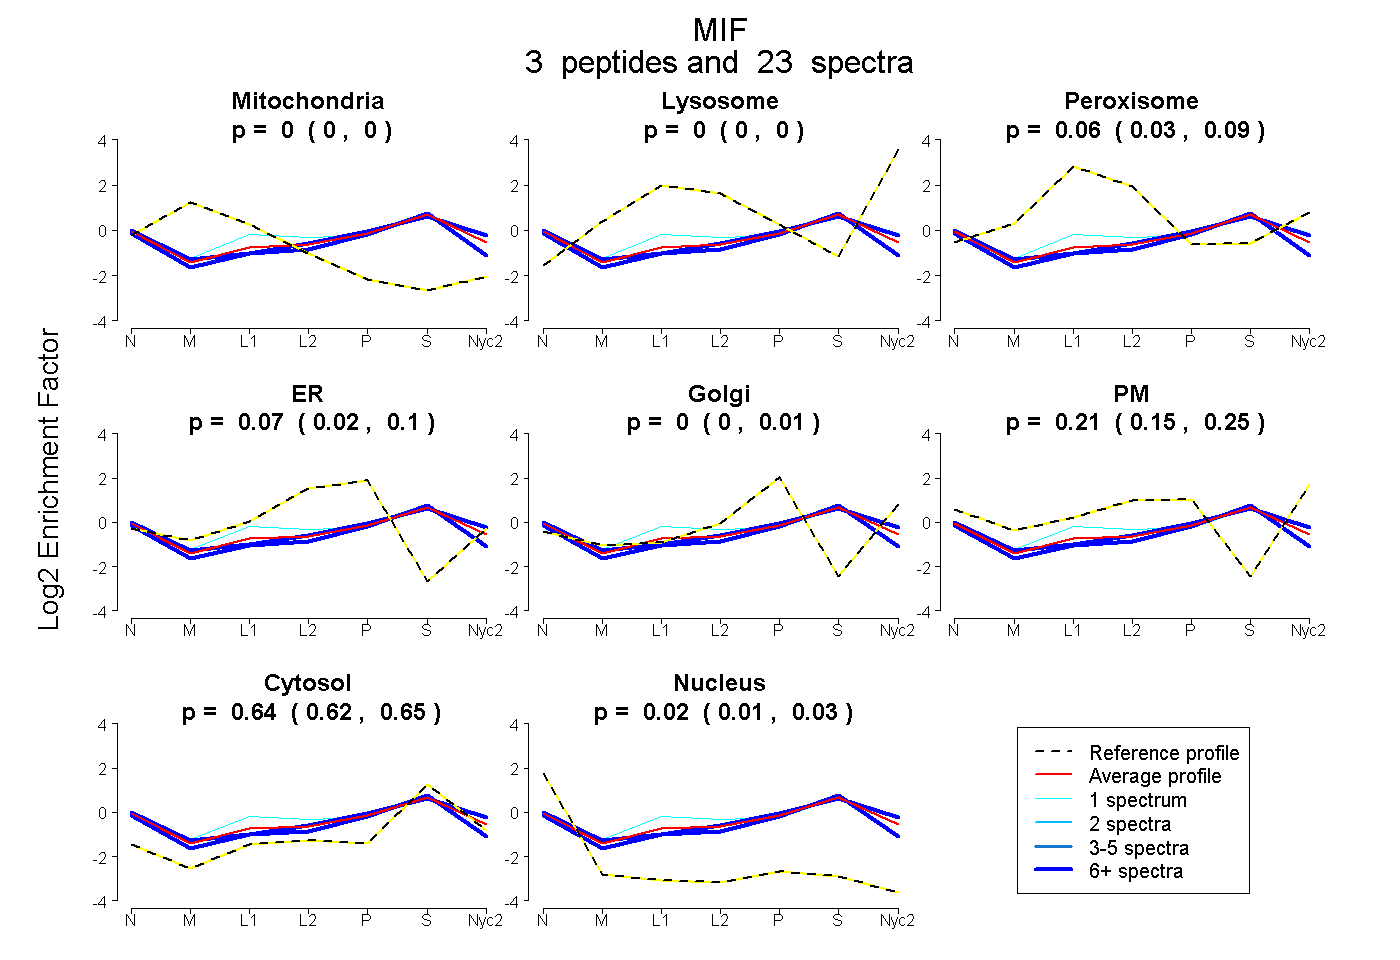
0.000 | 0.000
0.000 | 0.000
0.034 | 0.089
0.025 | 0.098
0.000 | 0.013
0.149 | 0.250
0.622 | 0.653
0.012 | 0.034
3peptides
spectra
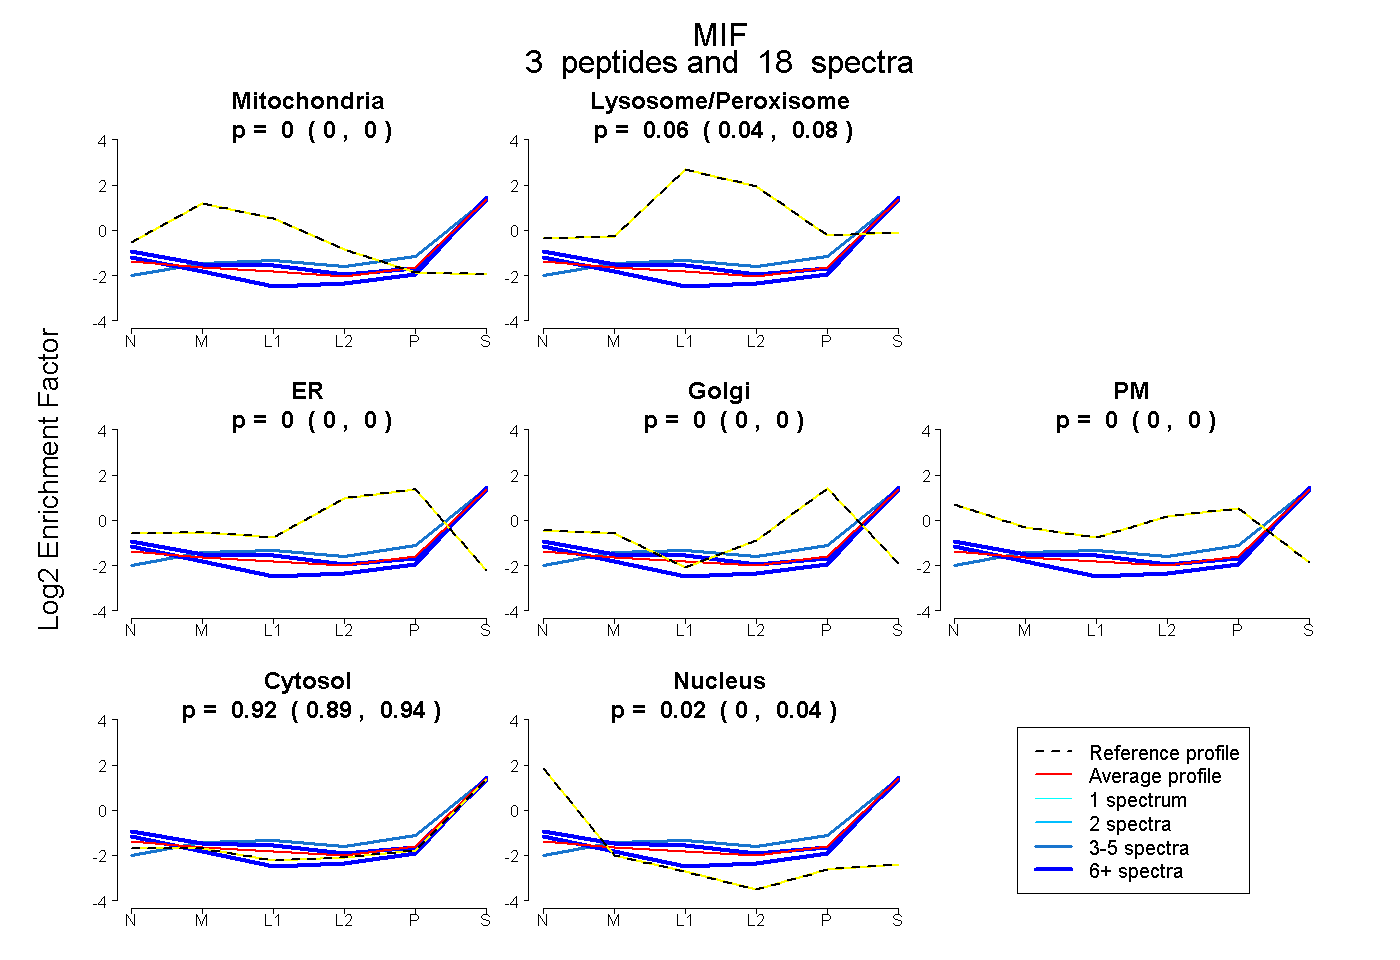
0.000 | 0.000
0.038 | 0.077
0.000 | 0.000
0.000 | 0.000
0.000 | 0.000
0.891 | 0.938
0.005 | 0.039
4peptides
spectra
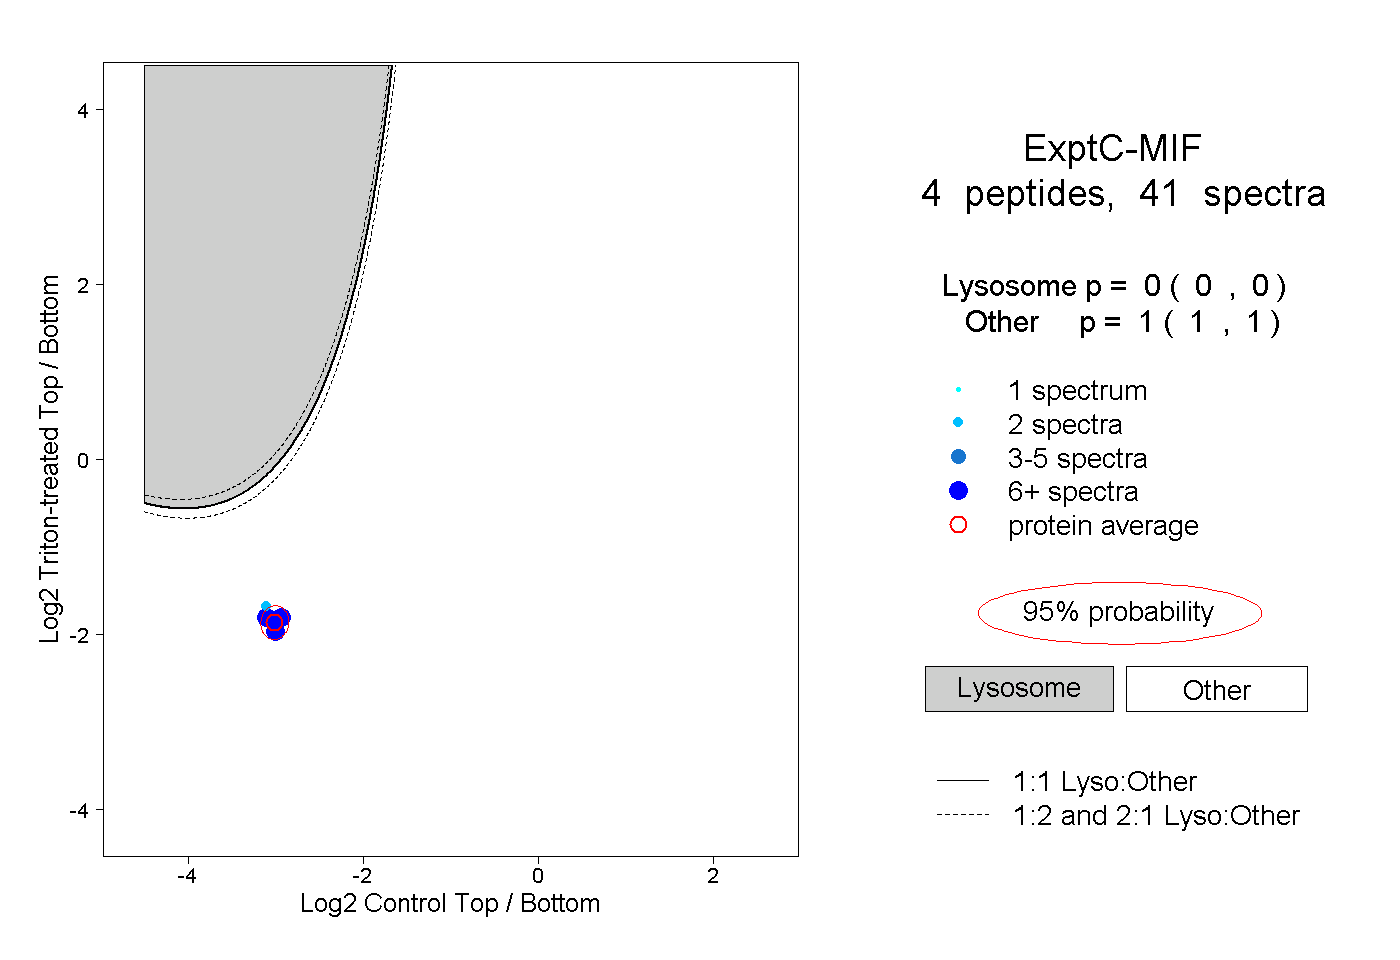
0.000 | 0.000
1.000 | 1.000
1peptide
spectrum
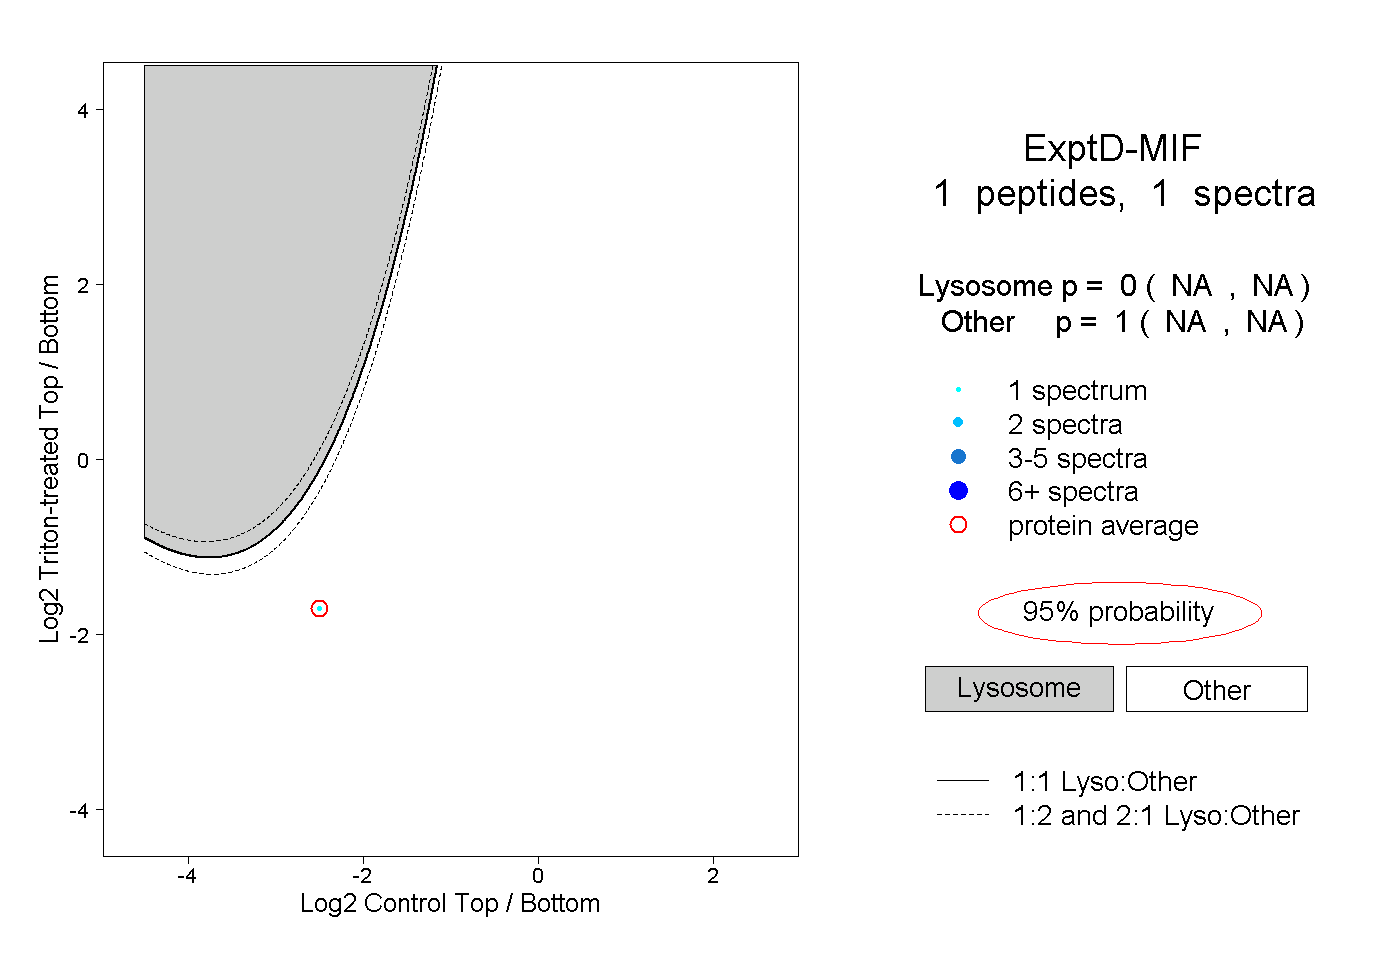
NA | NA
NA | NA