 2
2peptides
spectra
NA | NA
NA | NA
NA | NA
NA | NA
NA | NA
NA | NA
NA | NA
NA | NA
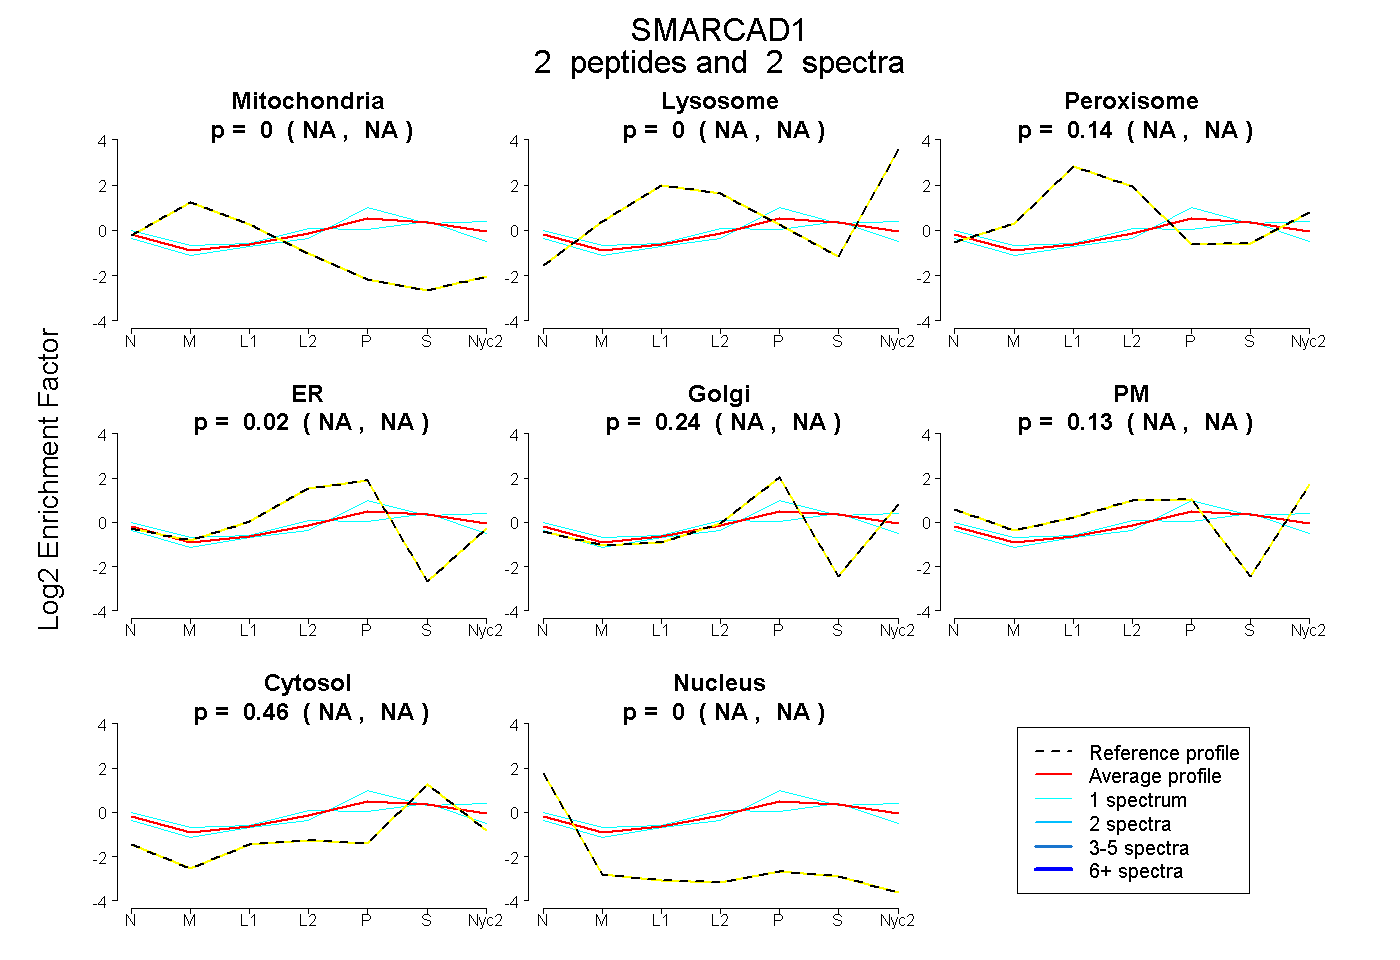
| Plot | Mito | Lyso | Perox | ER | Golgi | PM | Cytosol | Nucleus | |||||
| Expt A |
2 peptides |
2 spectra |
|
0.000 NA | NA |
0.000 NA | NA |
0.144 NA | NA |
0.016 NA | NA |
0.242 NA | NA |
0.134 NA | NA |
0.464 NA | NA |
0.000 NA | NA |
| 1 spectrum, MANHPLLHR | 0.044 | 0.000 | 0.138 | 0.161 | 0.000 | 0.160 | 0.497 | 0.000 | ||
| 1 spectrum, LLPPK | 0.000 | 0.057 | 0.075 | 0.000 | 0.426 | 0.020 | 0.422 | 0.000 |