 2
2peptides
spectra
0.000 | 0.054
0.000 | 0.076
0.000 | 0.005
0.000 | 0.044
0.000 | 0.139
0.000 | 0.111
0.000 | 0.257
0.696 | 0.979
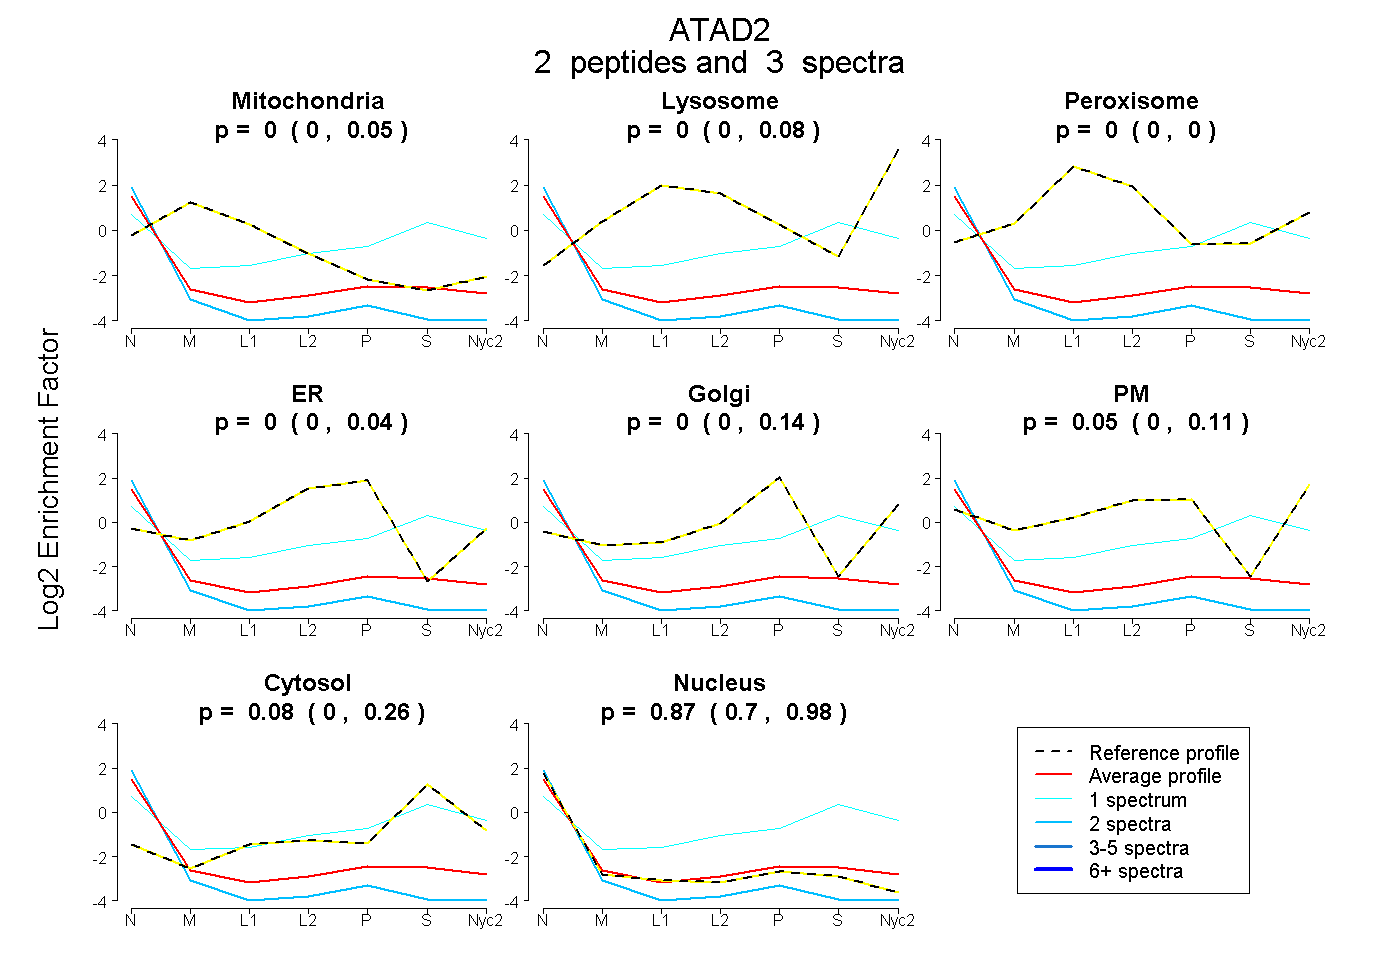
| Plot | Mito | Lyso | Perox | ER | Golgi | PM | Cytosol | Nucleus | |||||
| Expt A |
2 peptides |
3 spectra |
|
0.000 0.000 | 0.054 |
0.000 0.000 | 0.076 |
0.000 0.000 | 0.005 |
0.000 0.000 | 0.044 |
0.002 0.000 | 0.139 |
0.047 0.000 | 0.111 |
0.081 0.000 | 0.257 |
0.870 0.696 | 0.979 |