 21
21peptides
spectra
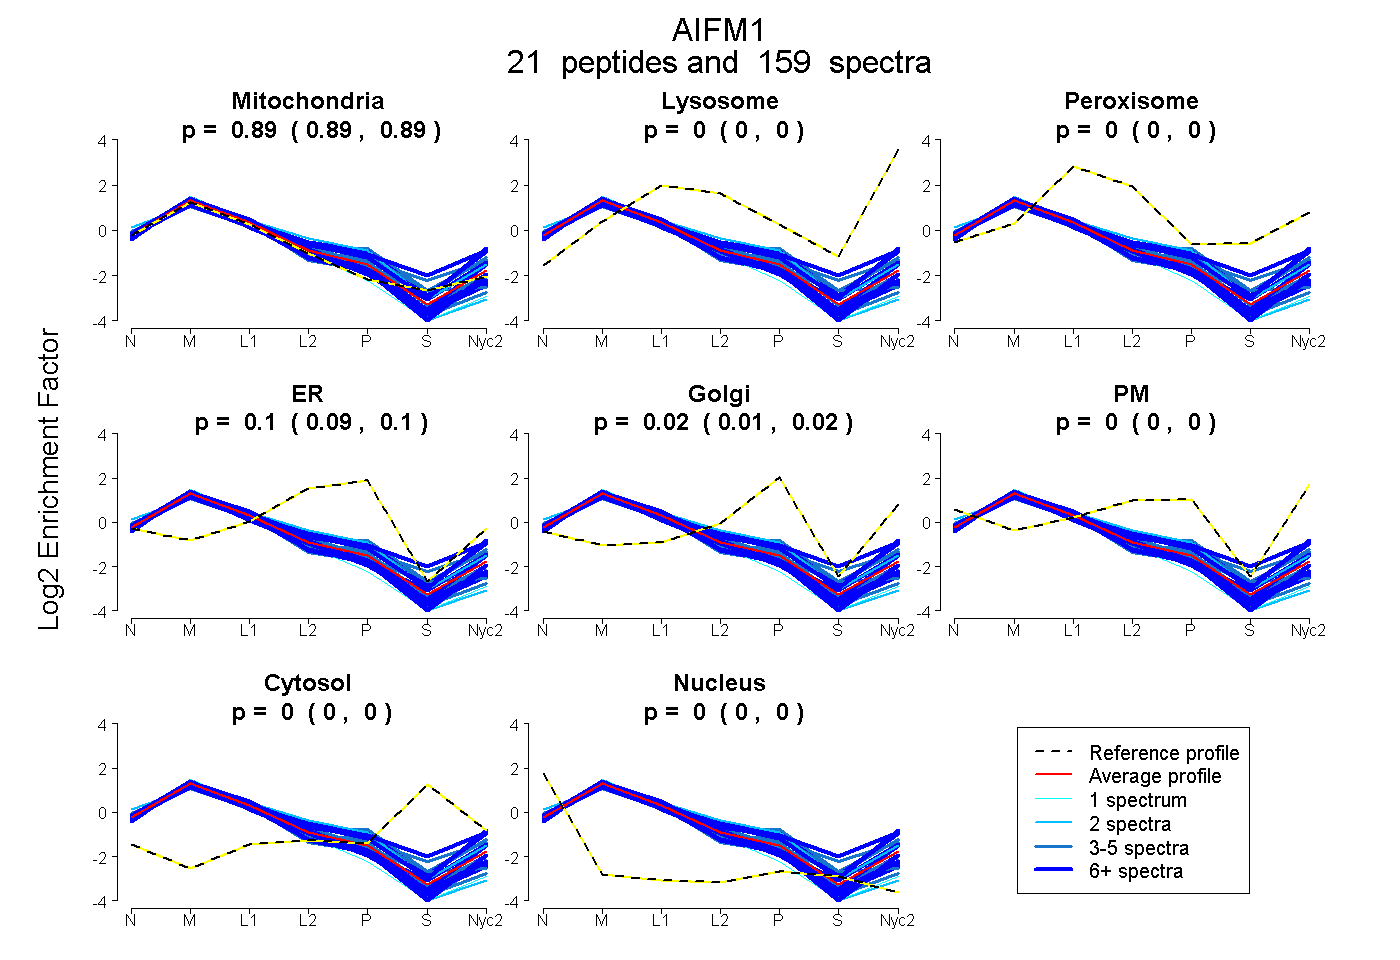
0.886 | 0.890
0.000 | 0.000
0.000 | 0.000
0.089 | 0.100
0.010 | 0.019
0.000 | 0.004
0.000 | 0.000
0.000 | 0.000
22peptides
spectra
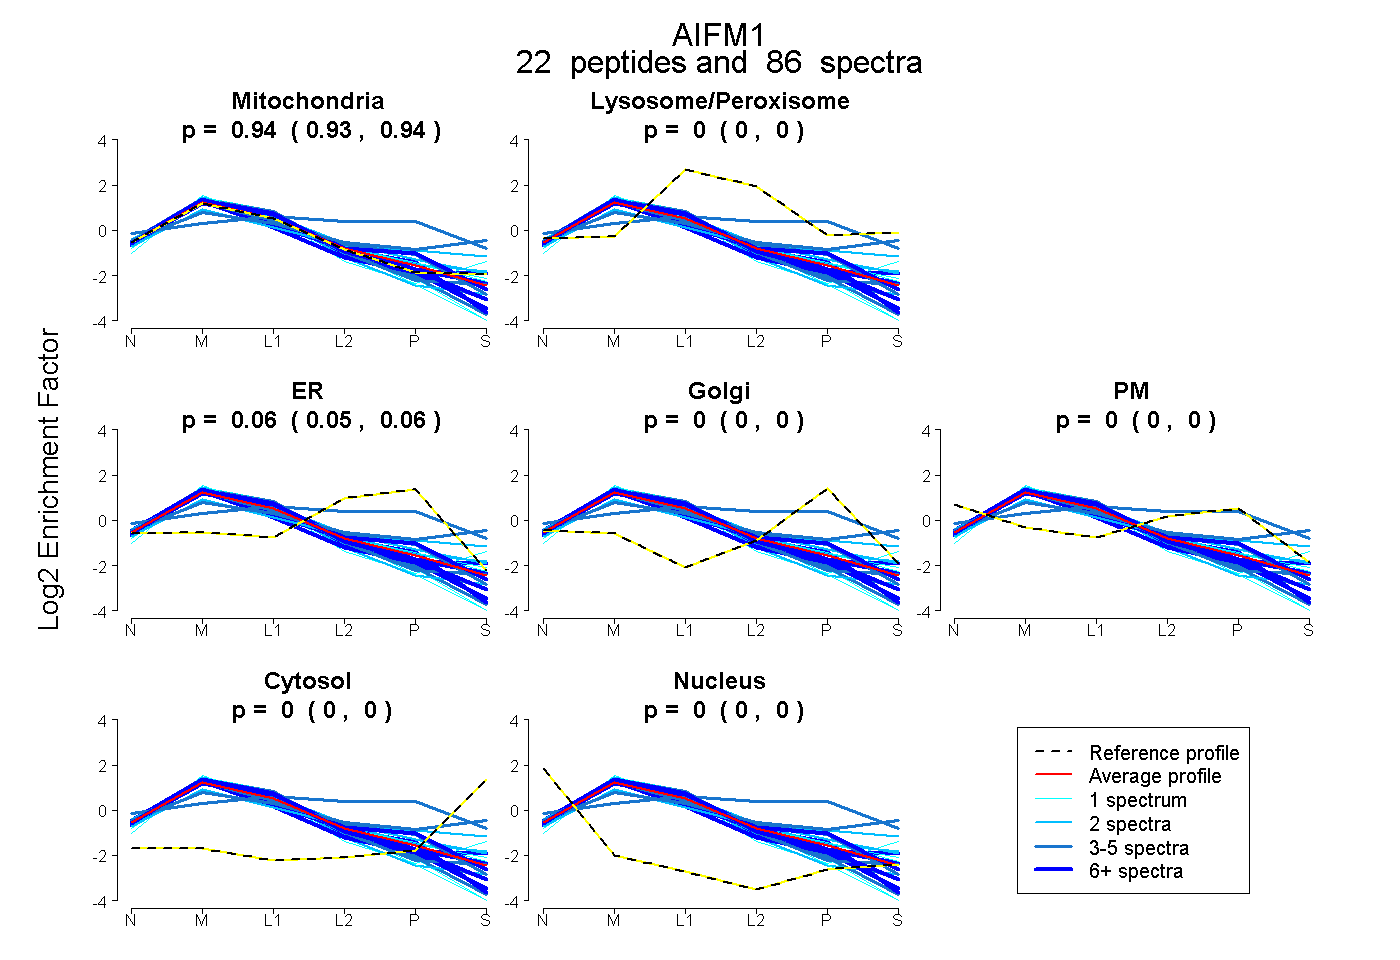
0.934 | 0.945
0.000 | 0.000
0.054 | 0.065
0.000 | 0.000
0.000 | 0.000
0.000 | 0.000
0.000 | 0.000
26peptides
spectra
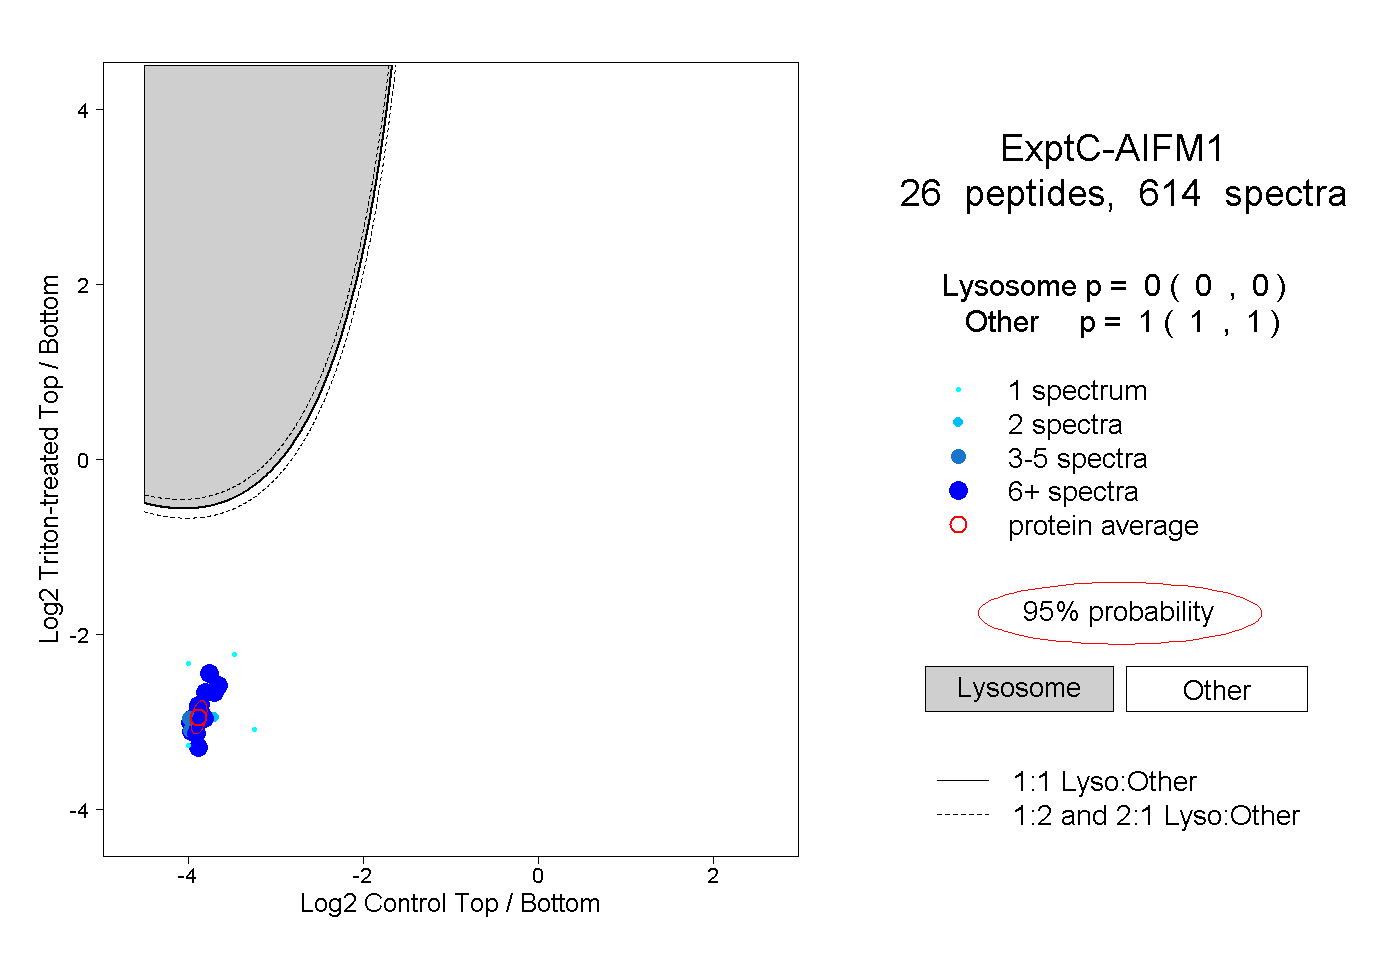
0.000 | 0.000
1.000 | 1.000
15peptides
spectra
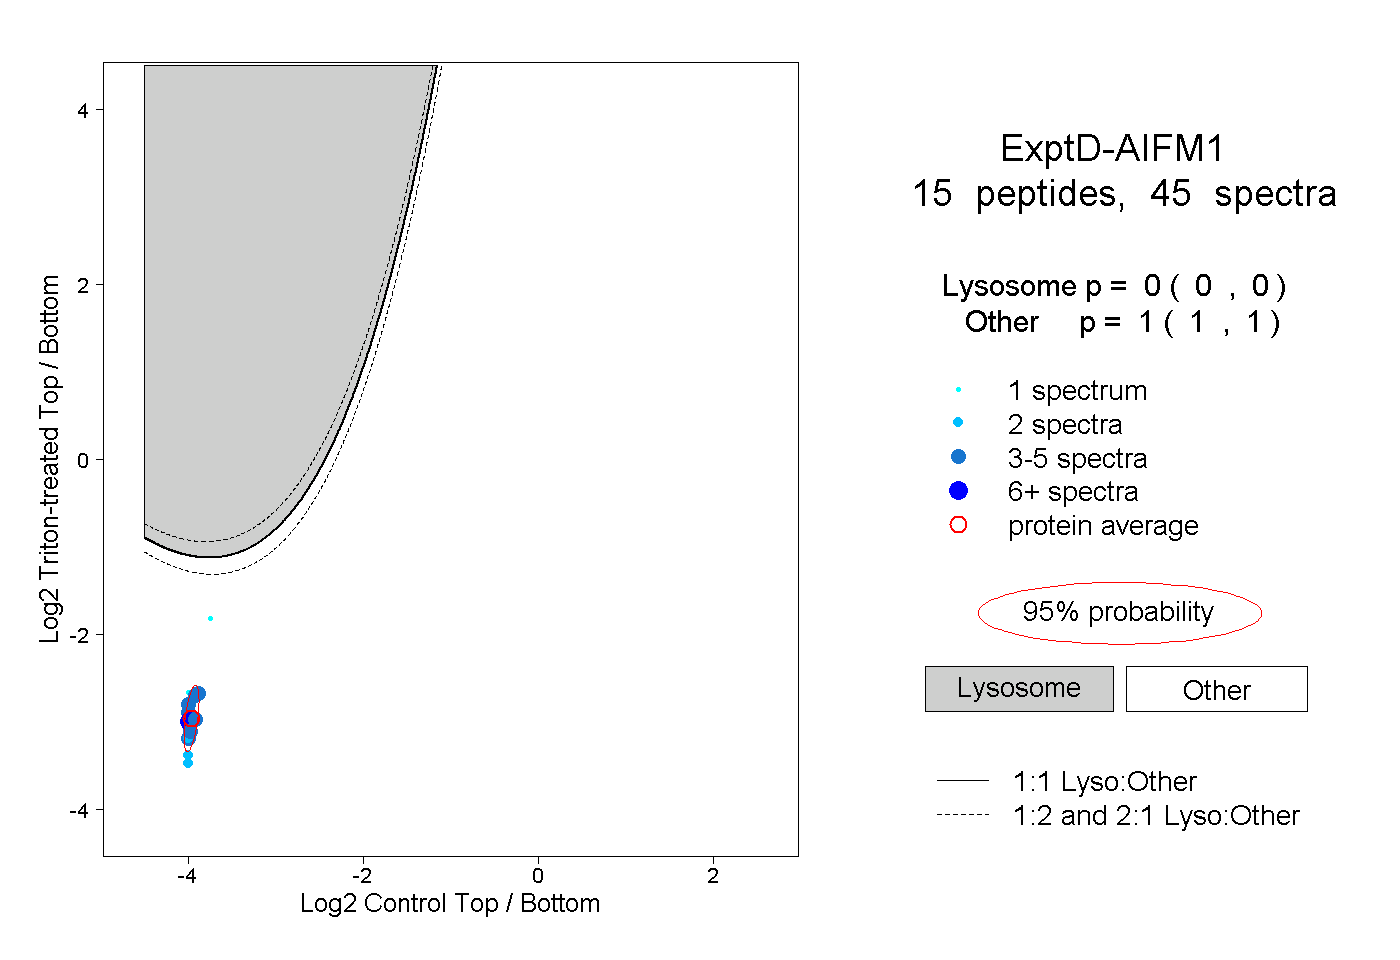
0.000 | 0.000
1.000 | 1.000