 14
14peptides
spectra
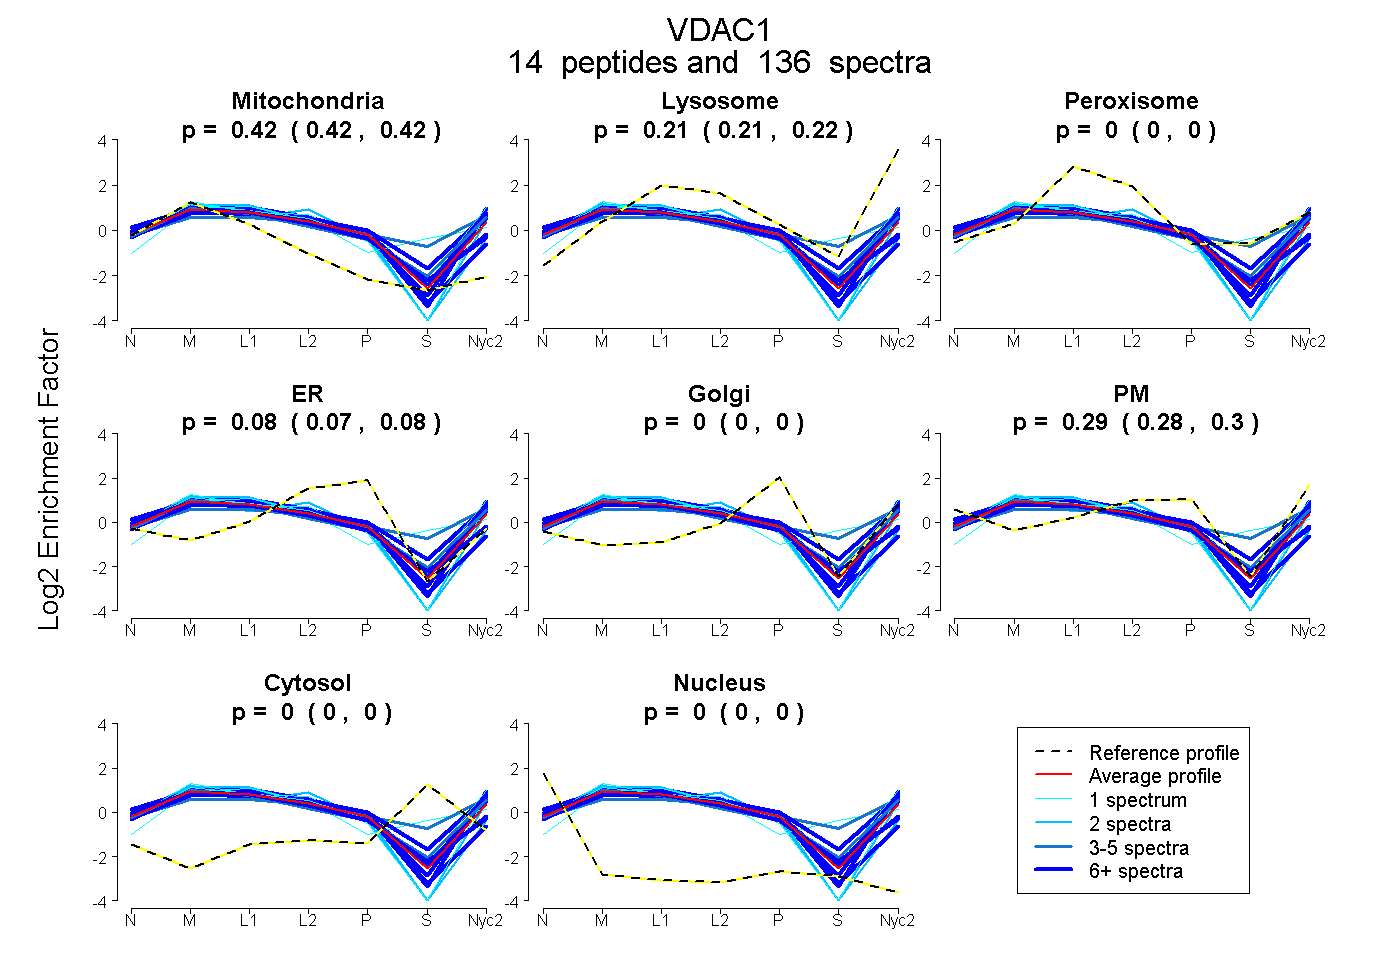
0.419 | 0.424
0.208 | 0.216
0.000 | 0.002
0.070 | 0.083
0.000 | 0.000
0.280 | 0.297
0.000 | 0.000
0.000 | 0.000
13peptides
spectra
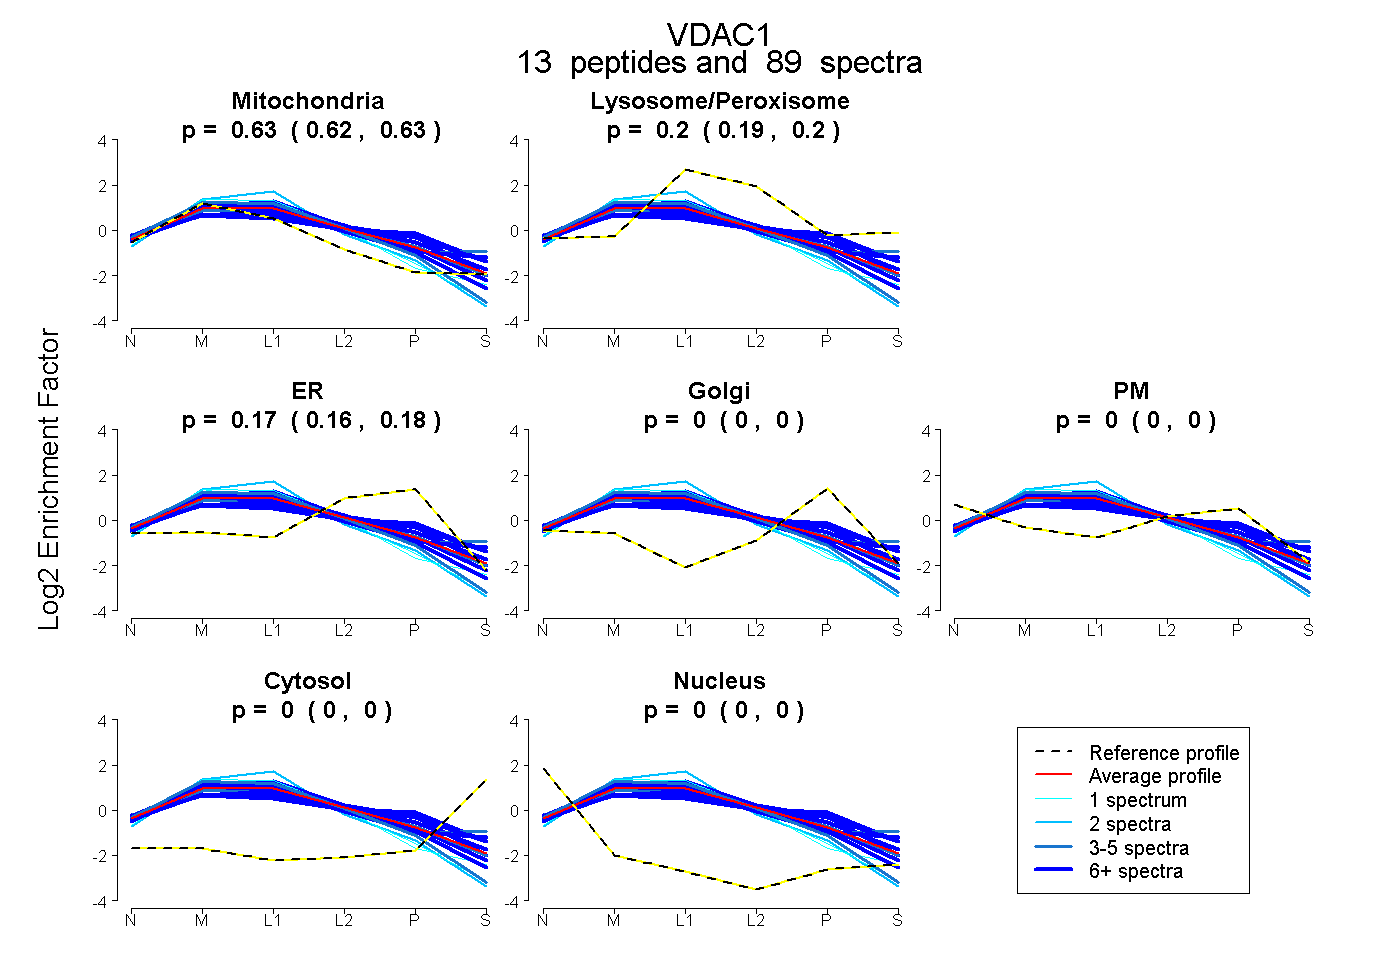
0.625 | 0.633
0.194 | 0.205
0.165 | 0.175
0.000 | 0.000
0.000 | 0.000
0.000 | 0.000
0.000 | 0.000
16peptides
spectra
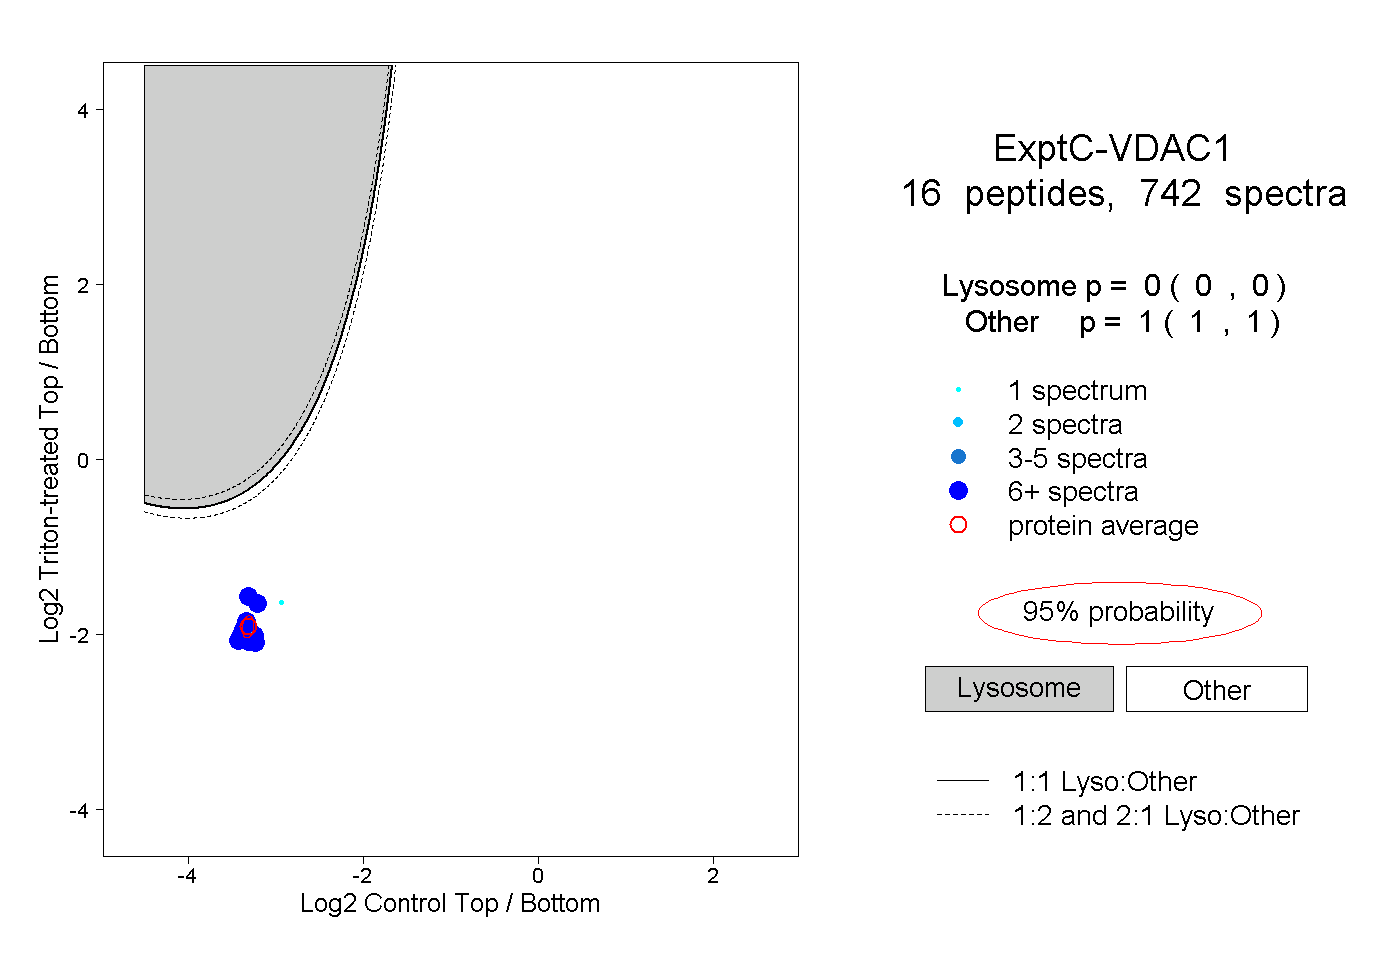
0.000 | 0.000
1.000 | 1.000
10peptides
spectra
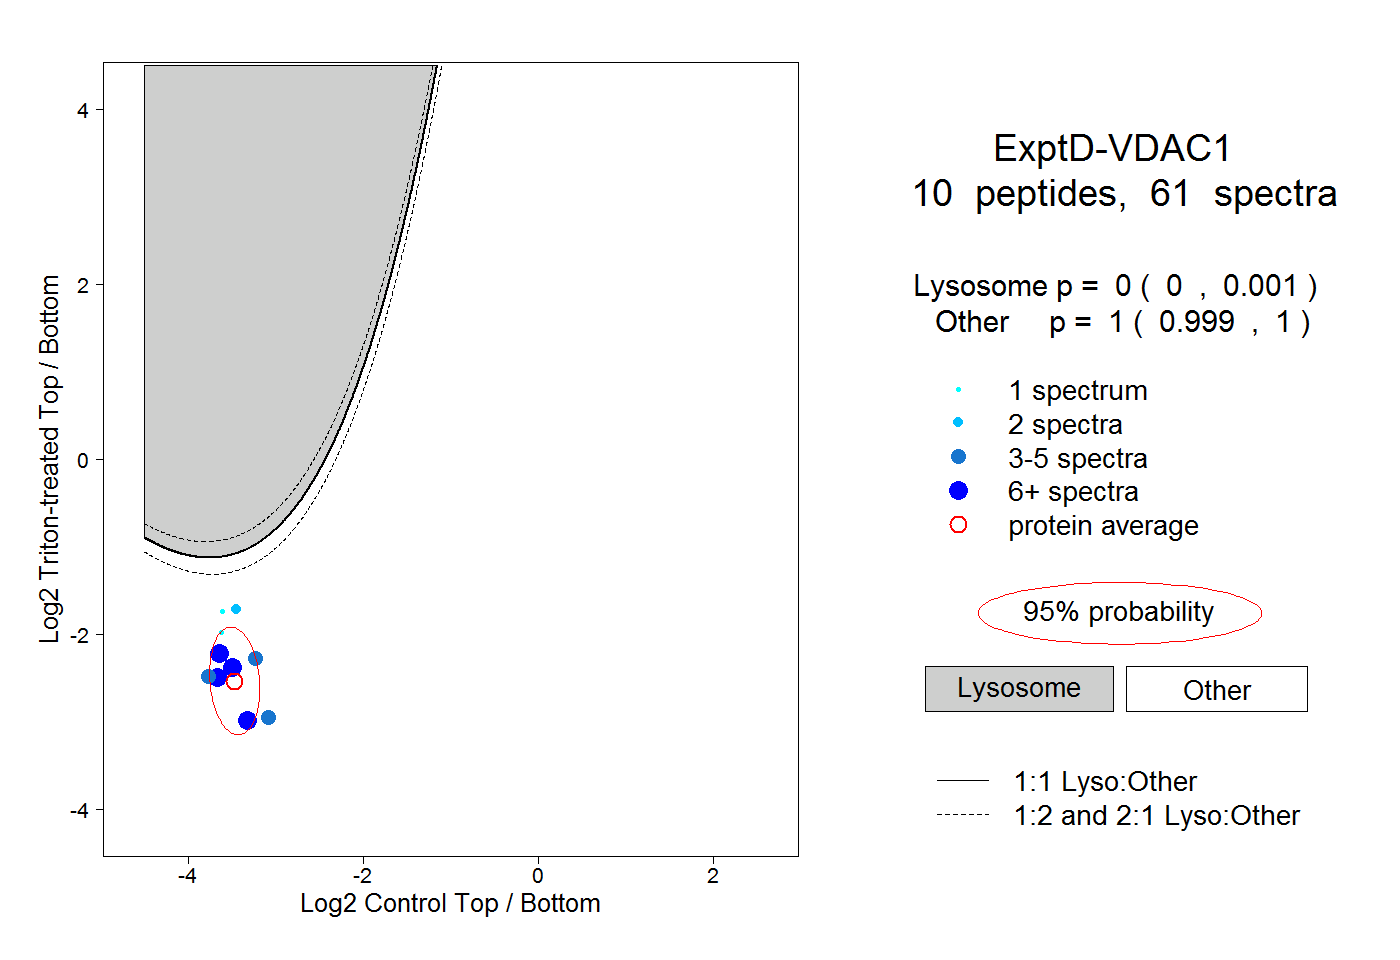
0.000 | 0.001
0.999 | 1.000