 4
4peptides
spectra
0.000 | 0.053
0.000 | 0.000
0.000 | 0.187
0.000 | 0.064
0.000 | 0.085
0.012 | 0.338
0.090 | 0.344
0.353 | 0.518
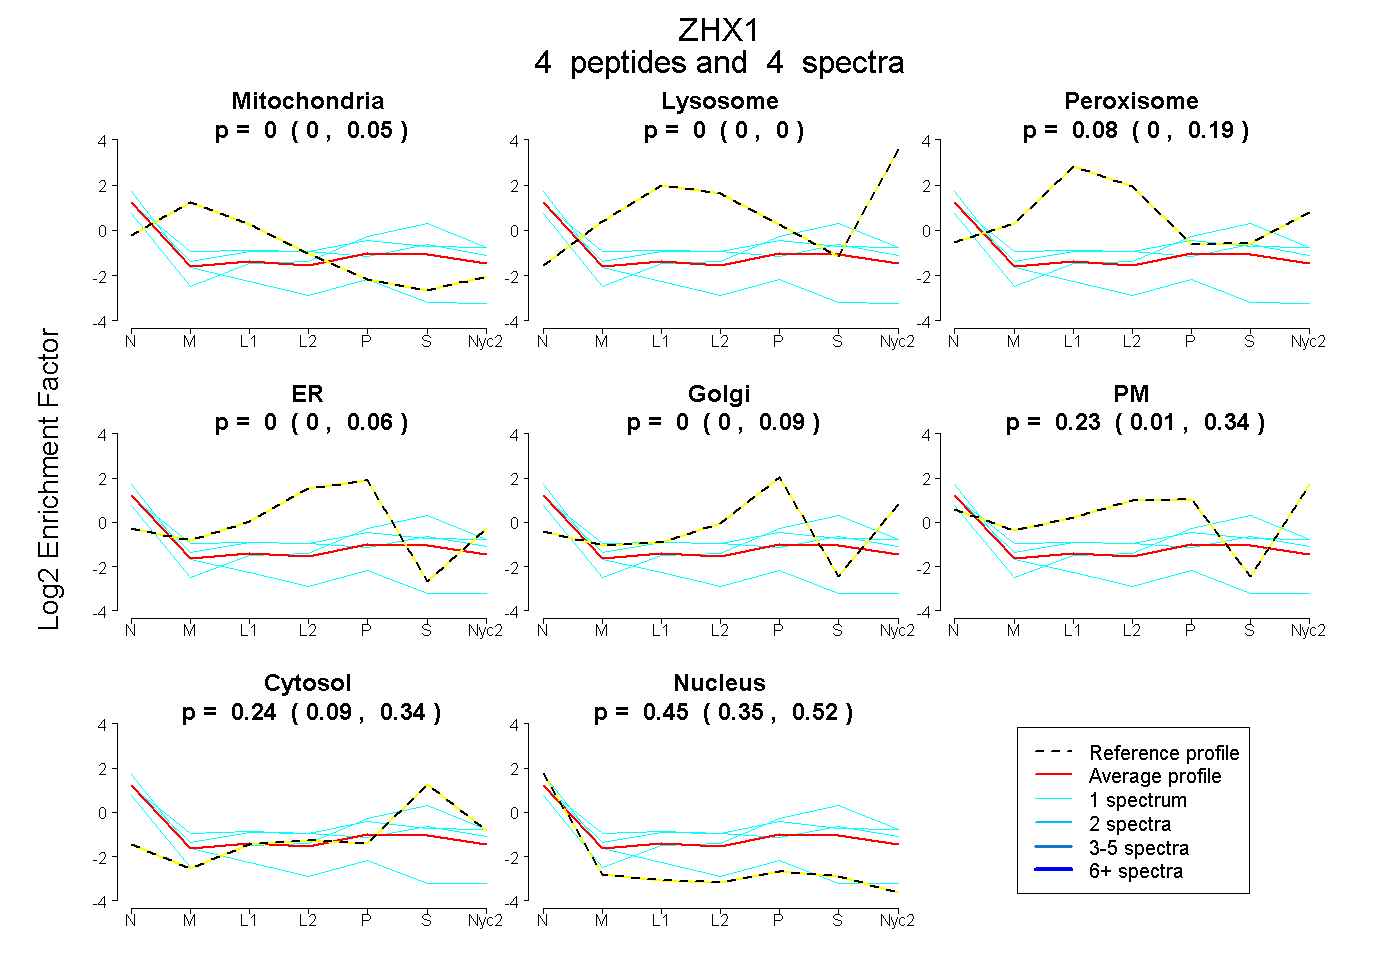
| Plot | Mito | Lyso | Perox | ER | Golgi | PM | Cytosol | Nucleus | |||||
| Expt A |
4 peptides |
4 spectra |
|
0.000 0.000 | 0.053 |
0.000 0.000 | 0.000 |
0.083 0.000 | 0.187 |
0.000 0.000 | 0.064 |
0.000 0.000 | 0.085 |
0.235 0.012 | 0.338 |
0.236 0.090 | 0.344 |
0.447 0.353 | 0.518 |
| 1 spectrum, EWFAER | 0.195 | 0.000 | 0.000 | 0.000 | 0.000 | 0.028 | 0.000 | 0.777 | ||
| 1 spectrum, HGVSWTPEEVEEAR | 0.011 | 0.000 | 0.253 | 0.000 | 0.000 | 0.157 | 0.206 | 0.373 | ||
| 1 spectrum, TAEQLR | 0.000 | 0.000 | 0.000 | 0.000 | 0.077 | 0.166 | 0.564 | 0.194 | ||
| 1 spectrum, IWFSAQR | 0.000 | 0.000 | 0.080 | 0.000 | 0.000 | 0.357 | 0.271 | 0.292 |