 10
10peptides
spectra
0.000 | 0.000
0.000 | 0.000
0.000 | 0.000
0.508 | 0.520
0.000 | 0.000
0.000 | 0.000
0.358 | 0.373
0.111 | 0.127
| Plot | Mito | Lyso | Perox | ER | Golgi | PM | Cytosol | Nucleus | |||||
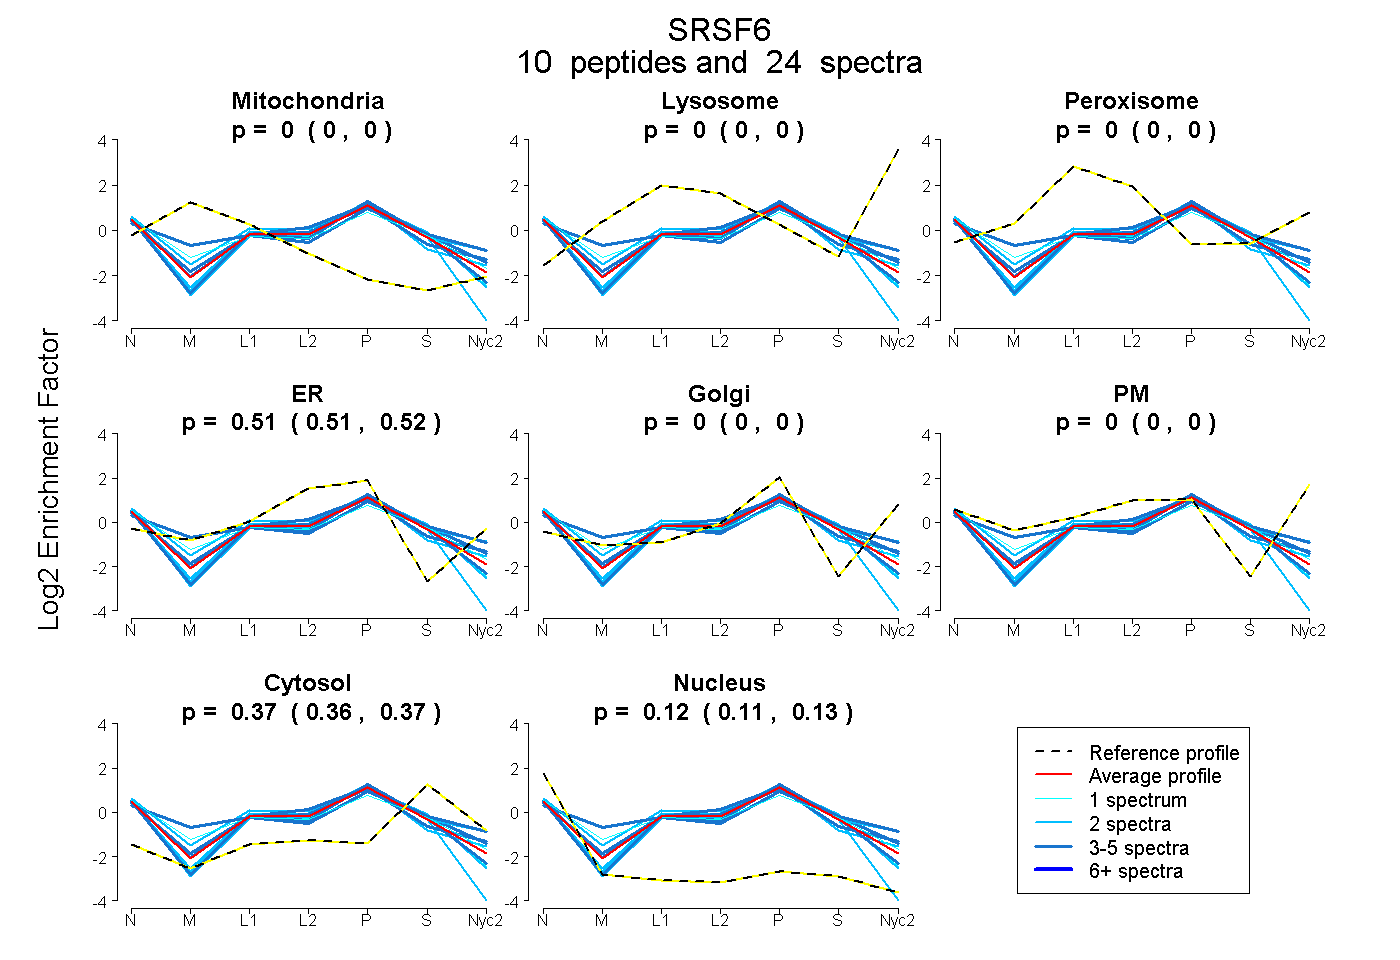
| Expt A |
10 peptides |
24 spectra |
|
0.000 0.000 | 0.000 |
0.000 0.000 | 0.000 |
0.000 0.000 | 0.000 |
0.514 0.508 | 0.520 |
0.000 0.000 | 0.000 |
0.000 0.000 | 0.000 |
0.366 0.358 | 0.373 |
0.119 0.111 | 0.127 |
| 3 spectra, DGYSYGSR | 0.000 | 0.000 | 0.003 | 0.473 | 0.000 | 0.000 | 0.419 | 0.105 | ||
| 4 spectra, TNEGVIEFR | 0.085 | 0.000 | 0.033 | 0.542 | 0.000 | 0.000 | 0.286 | 0.054 | ||
| 1 spectrum, LLEIDLK | 0.000 | 0.000 | 0.000 | 0.445 | 0.000 | 0.000 | 0.399 | 0.157 | ||
| 1 spectrum, YGPPVR | 0.000 | 0.000 | 0.101 | 0.423 | 0.000 | 0.000 | 0.327 | 0.149 | ||
| 2 spectra, FFSGYGR | 0.000 | 0.000 | 0.072 | 0.569 | 0.000 | 0.000 | 0.220 | 0.139 | ||
| 3 spectra, NGYGFVEFEDSR | 0.000 | 0.000 | 0.014 | 0.549 | 0.000 | 0.000 | 0.419 | 0.018 | ||
| 2 spectra, LIEDKPR | 0.000 | 0.000 | 0.000 | 0.426 | 0.000 | 0.000 | 0.286 | 0.288 | ||
| 2 spectra, DADDAVYELNSK | 0.000 | 0.000 | 0.000 | 0.461 | 0.000 | 0.000 | 0.397 | 0.142 | ||
| 2 spectra, ELCGER | 0.000 | 0.000 | 0.000 | 0.543 | 0.000 | 0.000 | 0.414 | 0.042 | ||
| 4 spectra, SGGGGYSSR | 0.000 | 0.000 | 0.000 | 0.470 | 0.000 | 0.000 | 0.374 | 0.156 |
| Plot | Mito | Lyso or Perox | ER | Golgi | PM | Cytosol | Nucleus | ||||||
| Expt B |
3 peptides |
6 spectra |
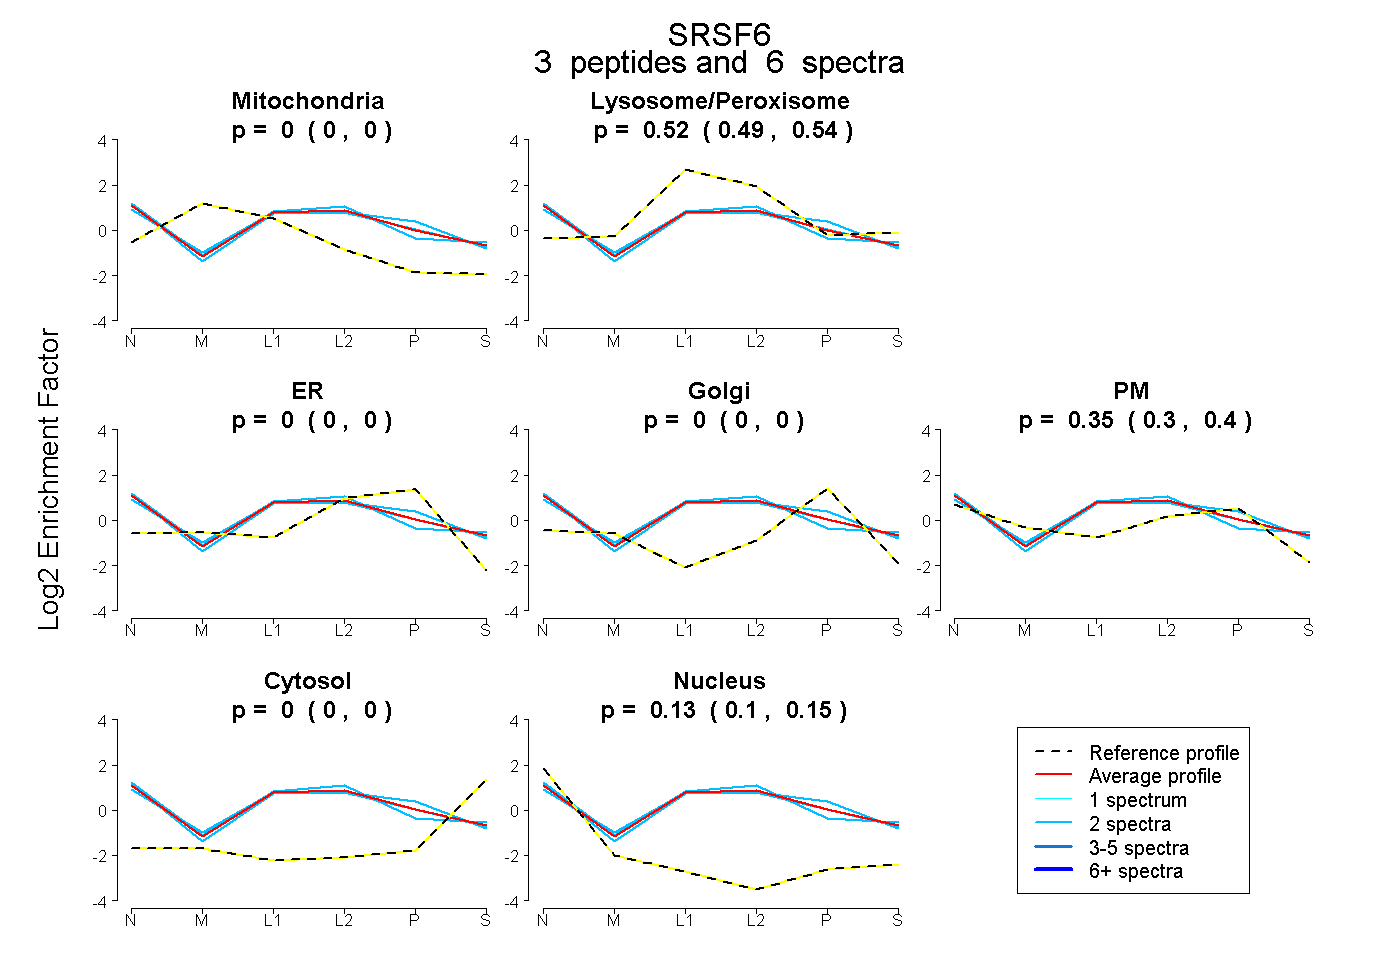 |
0.000 0.000 | 0.000 |
0.520 0.493 | 0.541 |
0.000 0.000 | 0.000 |
0.000 0.000 | 0.000 |
0.353 0.302 | 0.401 |
0.000 0.000 | 0.000 |
0.127 0.097 | 0.151 |
|||
| Plot | Lyso | Other | |||||||||||
| Expt C |
11 peptides |
36 spectra |
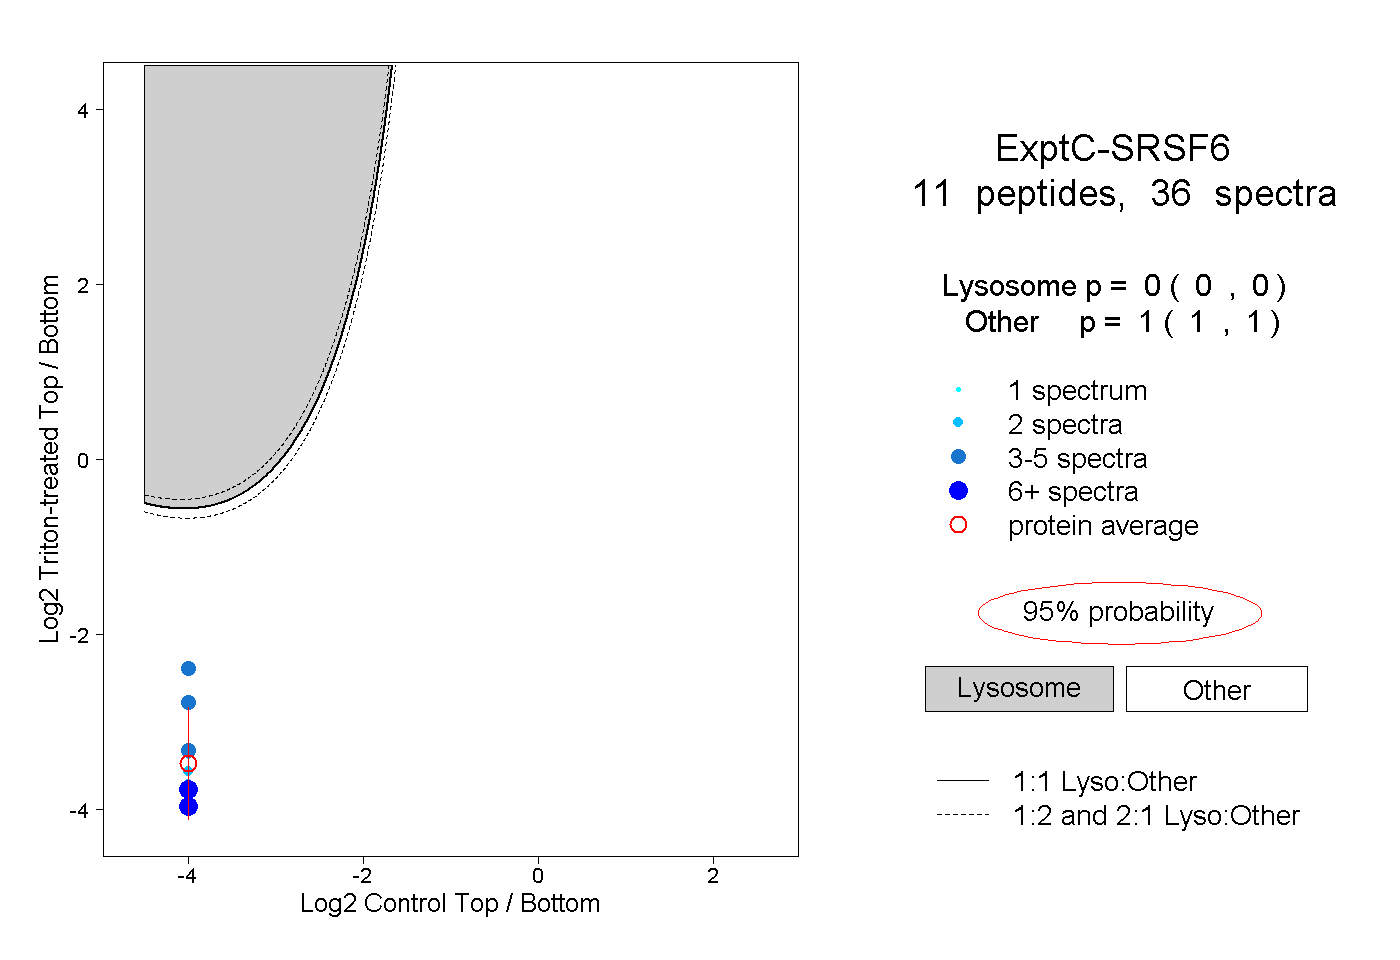 |
0.000 0.000 | 0.000 |
1.000 1.000 | 1.000 |
||||||||
| Plot | Lyso | Other | |||||||||||
| Expt D |
2 peptides |
3 spectra |
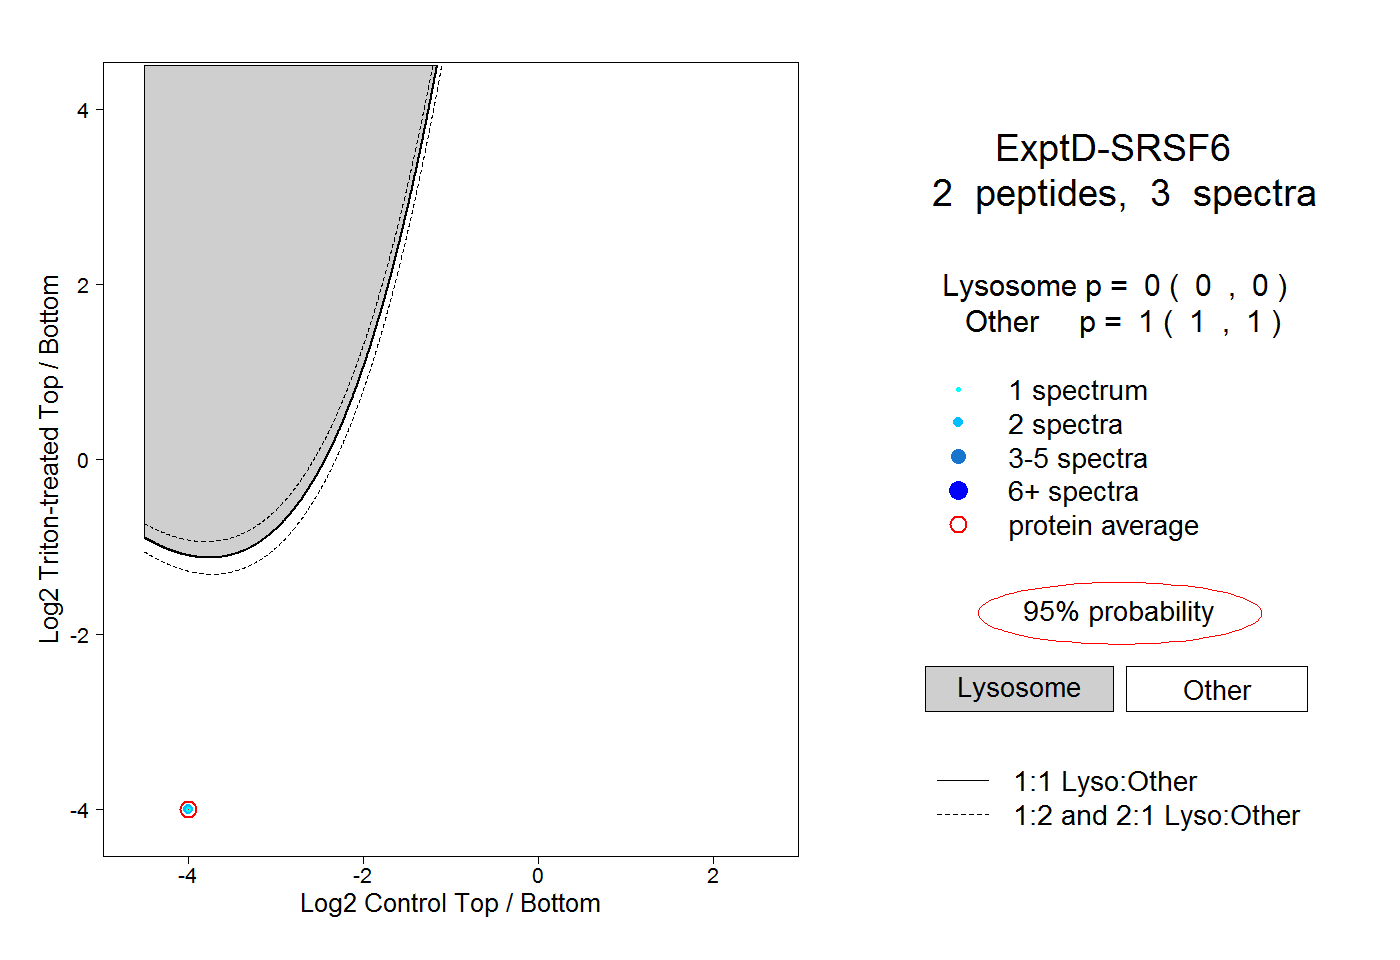 |
0.000 0.000 | 0.000 |
1.000 1.000 | 1.000 |