 16
16peptides
spectra
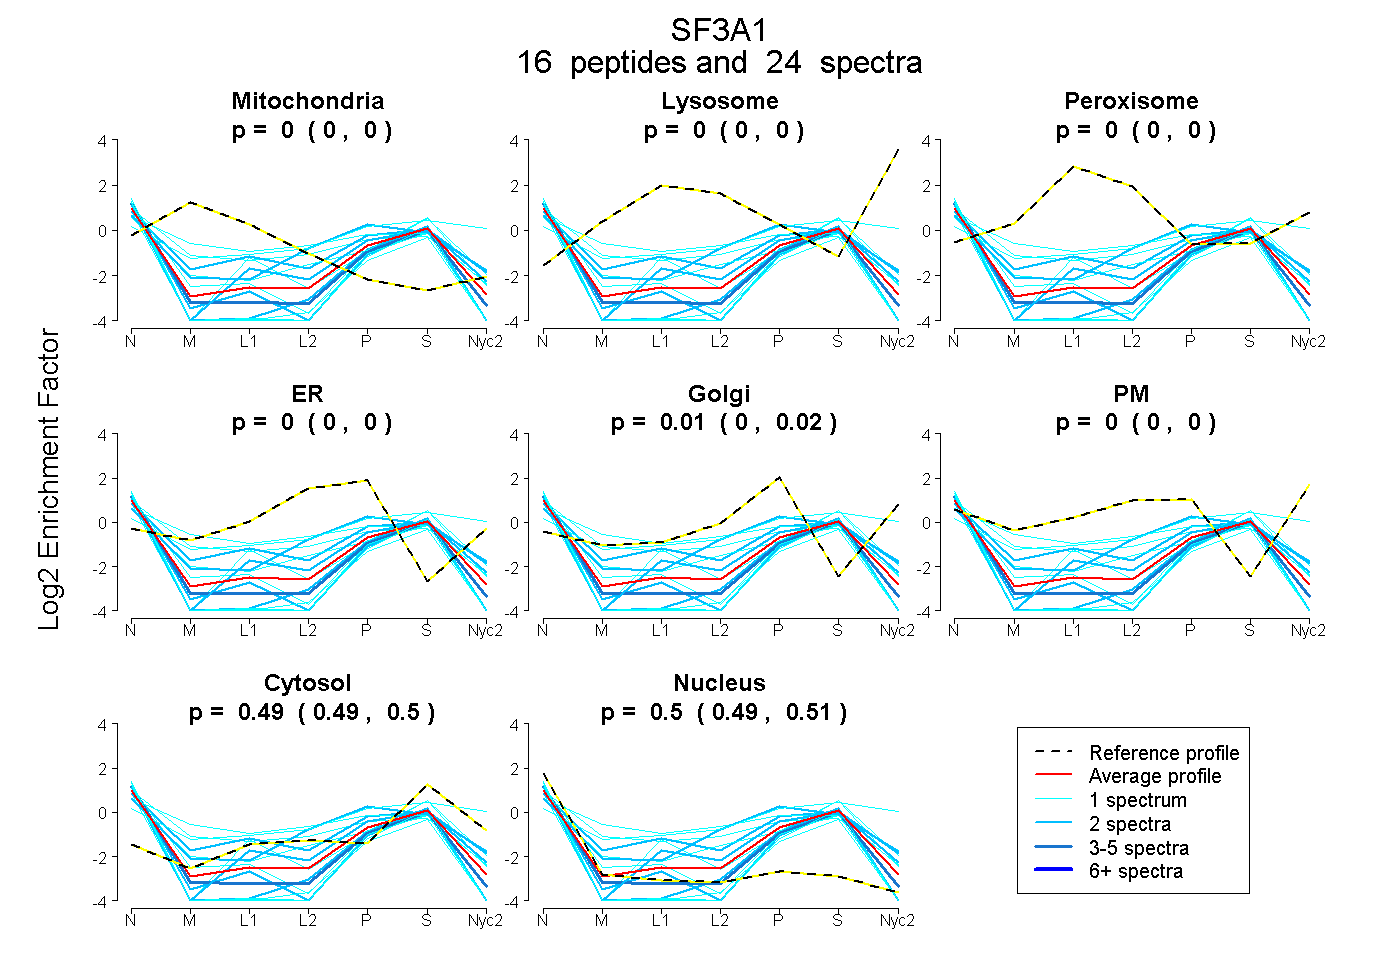
0.000 | 0.000
0.000 | 0.000
0.000 | 0.000
0.000 | 0.000
0.000 | 0.020
0.000 | 0.000
0.485 | 0.499
0.486 | 0.508
2peptides
spectra
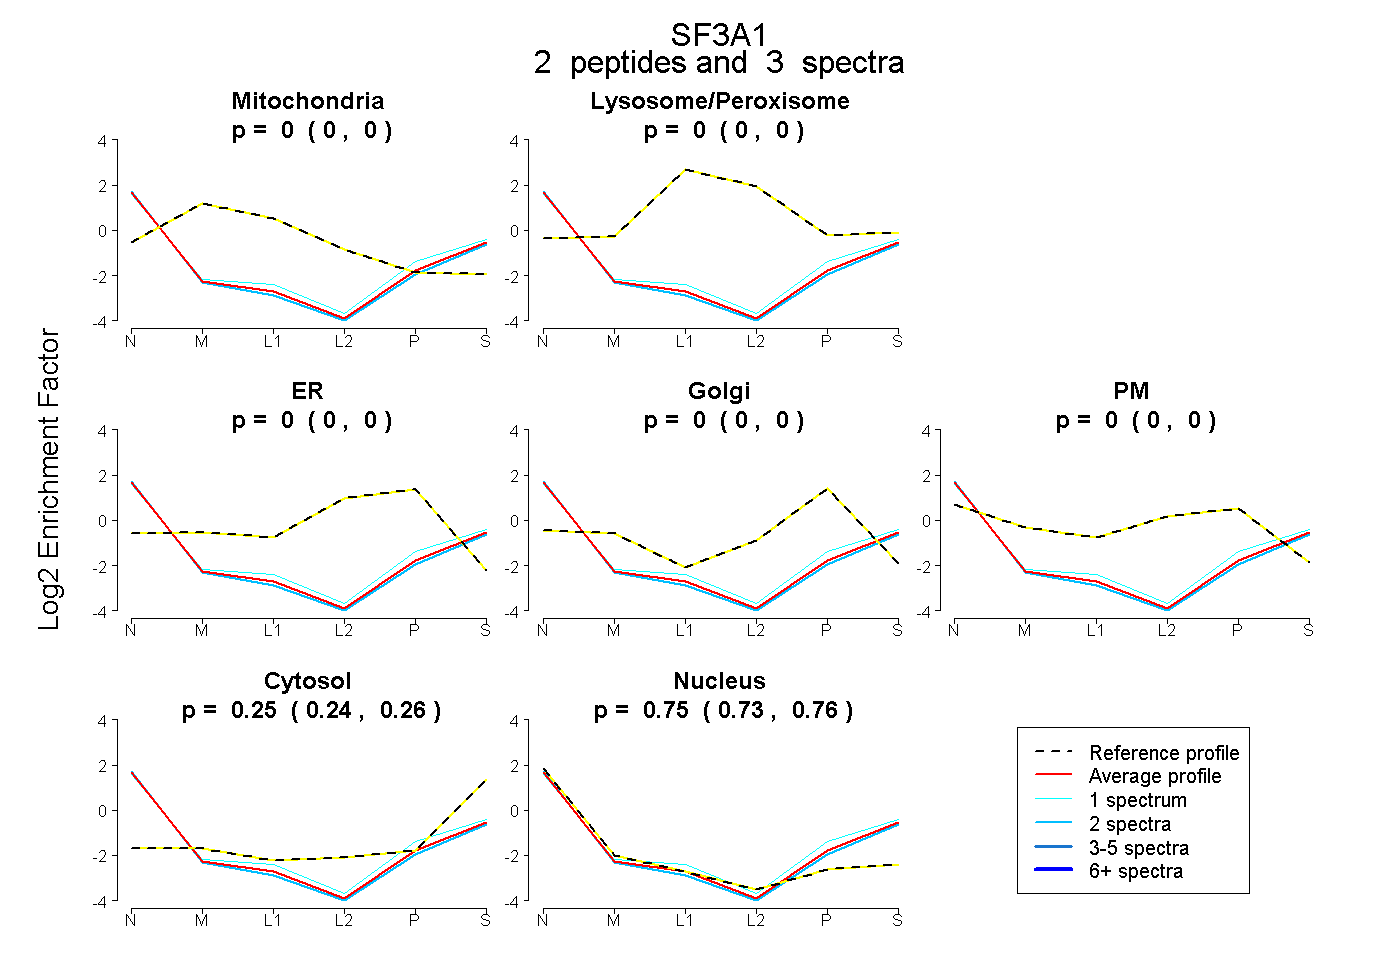
0.000 | 0.000
0.000 | 0.000
0.000 | 0.000
0.000 | 0.000
0.000 | 0.000
0.238 | 0.264
0.734 | 0.759