 38
38peptides
spectra
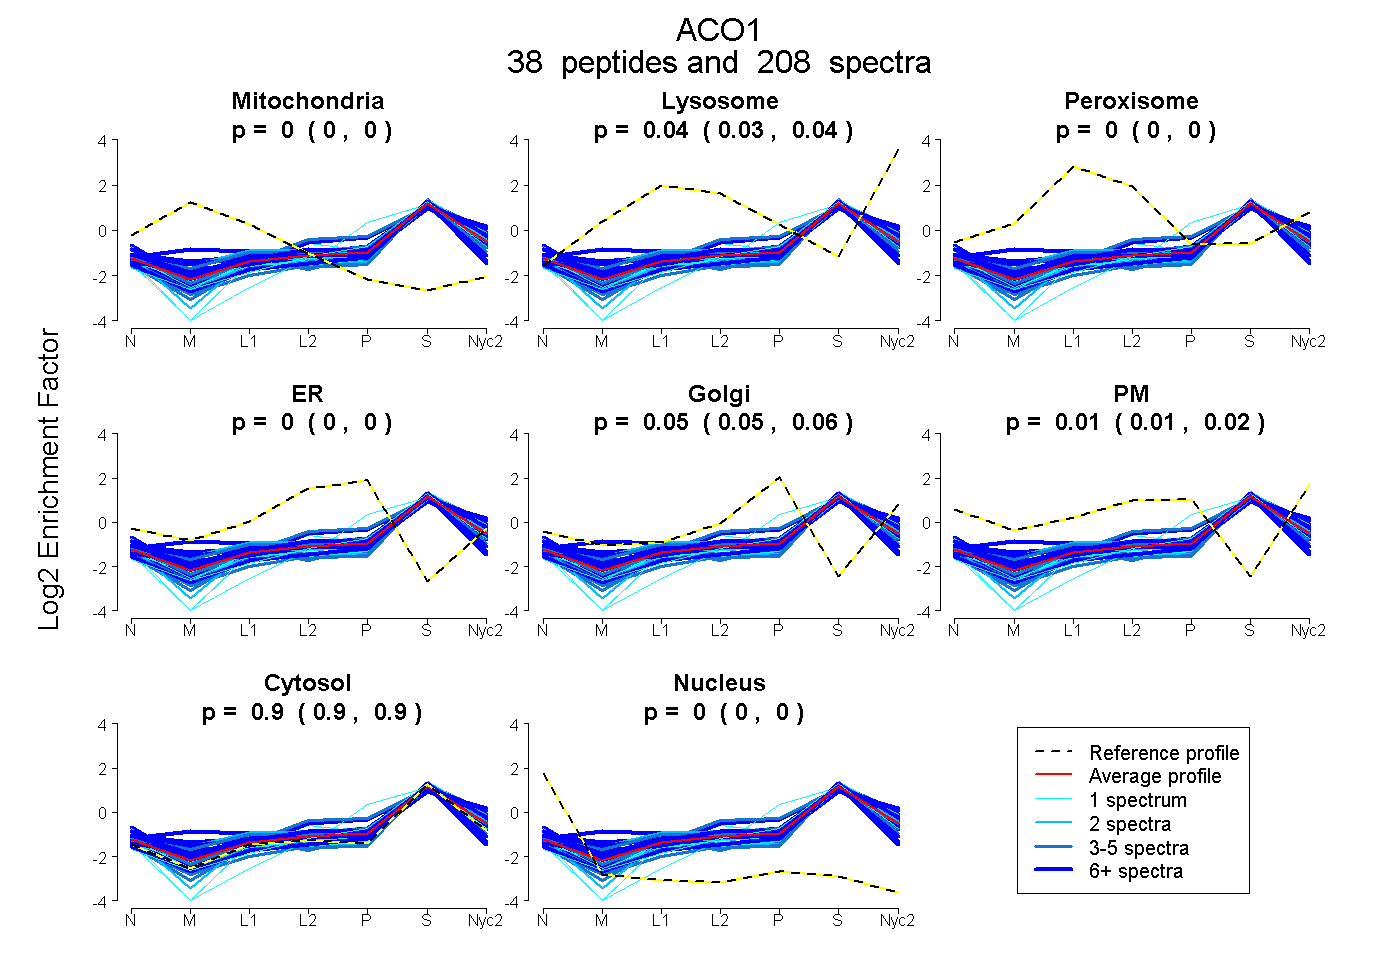
0.000 | 0.000
0.034 | 0.037
0.000 | 0.000
0.000 | 0.000
0.049 | 0.055
0.008 | 0.015
0.898 | 0.901
0.000 | 0.000
21peptides
spectra
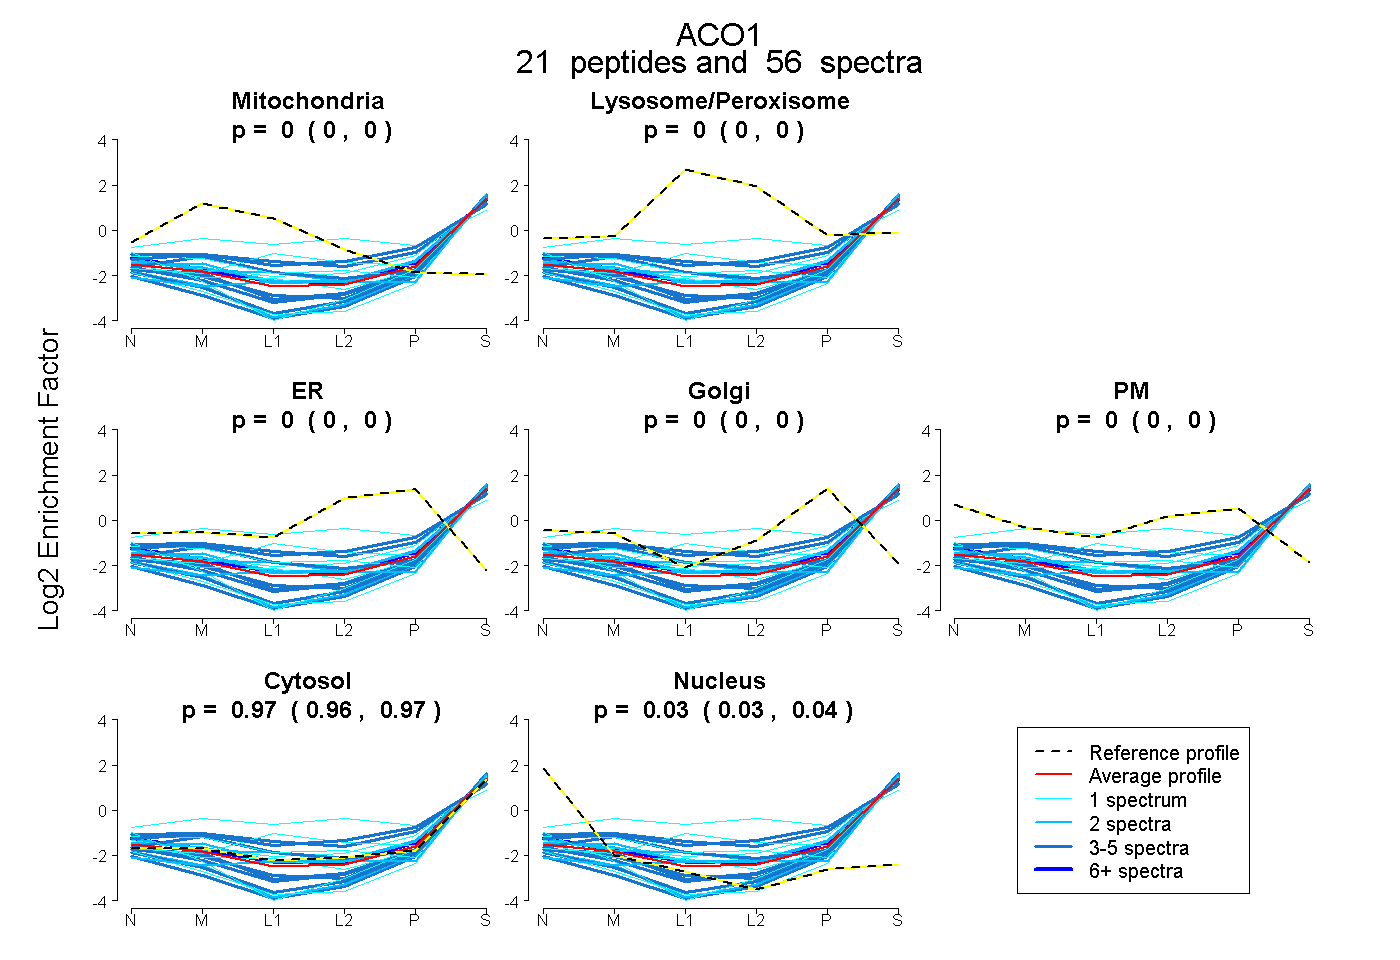
0.000 | 0.000
0.000 | 0.000
0.000 | 0.000
0.000 | 0.000
0.000 | 0.000
0.964 | 0.970
0.029 | 0.036
38peptides
spectra
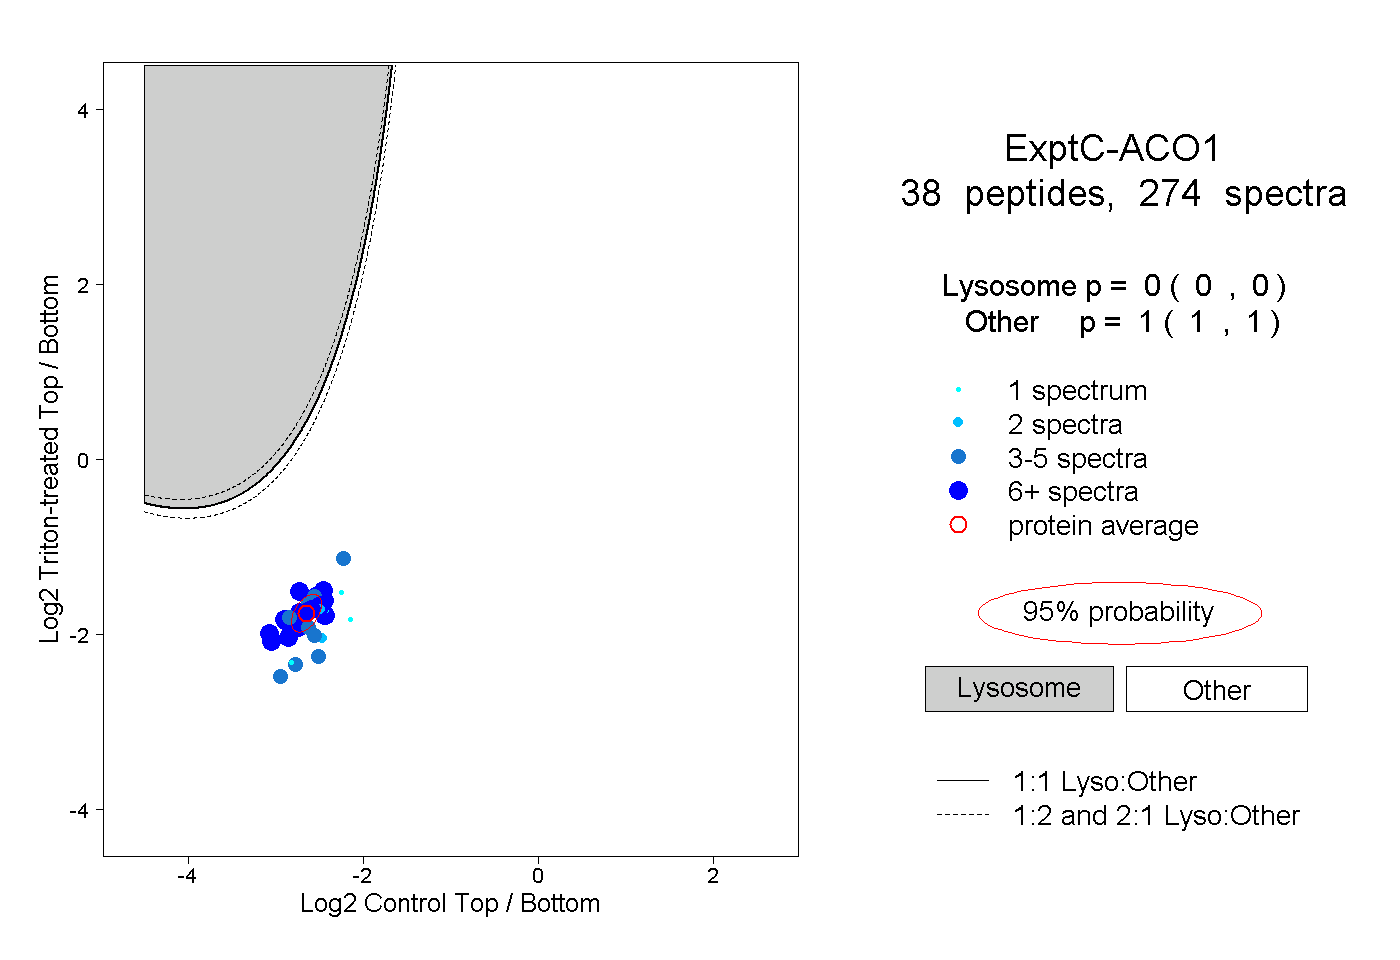
0.000 | 0.000
1.000 | 1.000
9peptides
spectra
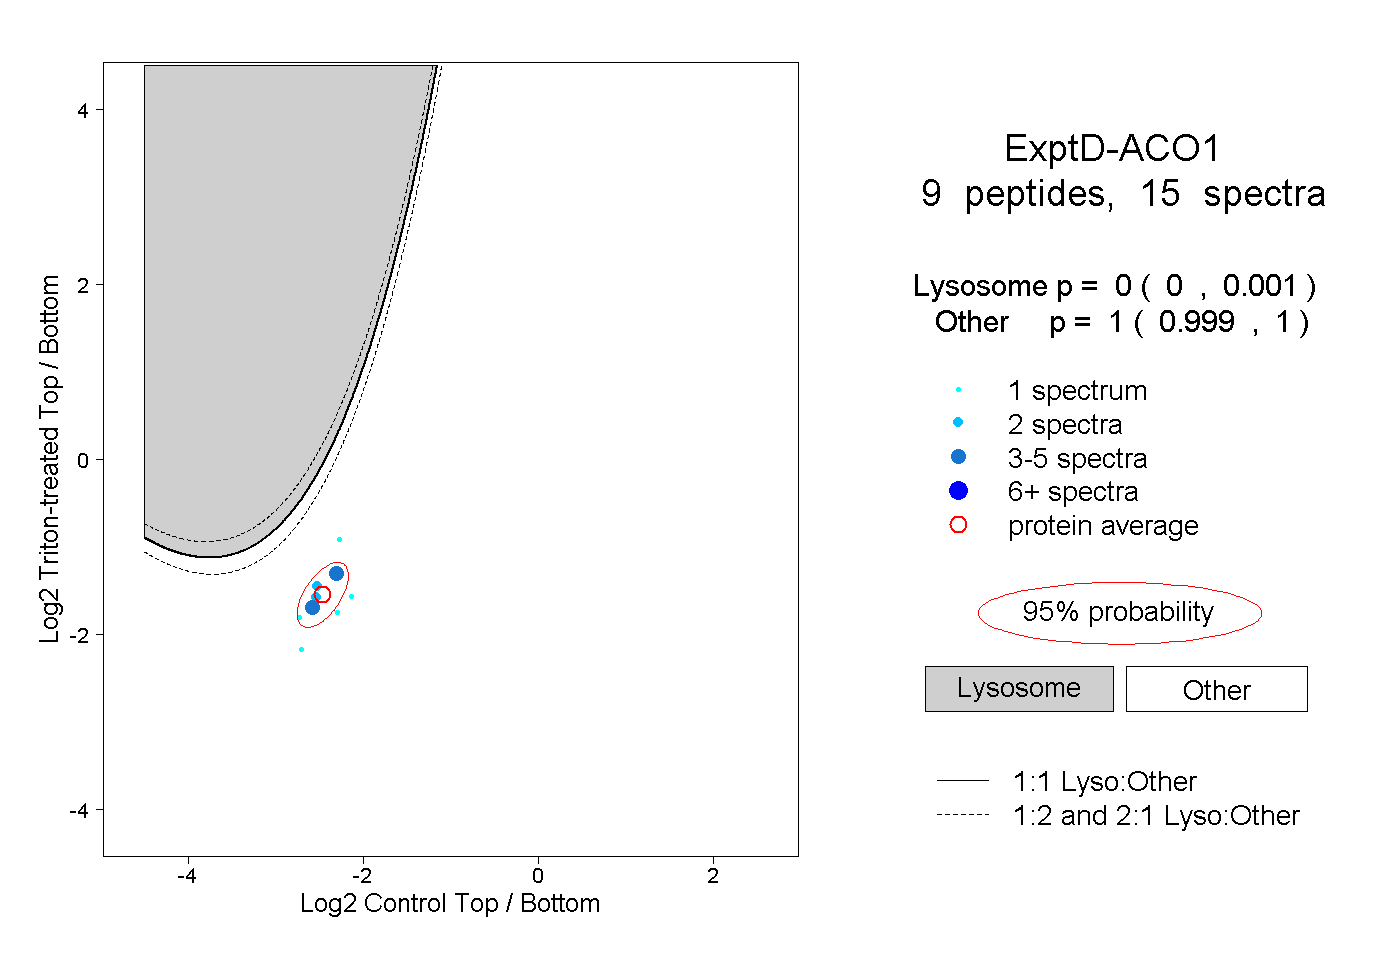
0.000 | 0.001
0.999 | 1.000