 1
1peptide
spectra
0.000 | 0.111
0.000 | 0.000
0.000 | 0.129
0.135 | 0.562
0.000 | 0.291
0.000 | 0.000
0.323 | 0.467
0.000 | 0.007
| Plot | Mito | Lyso | Perox | ER | Golgi | PM | Cytosol | Nucleus | |||||
| Expt A |
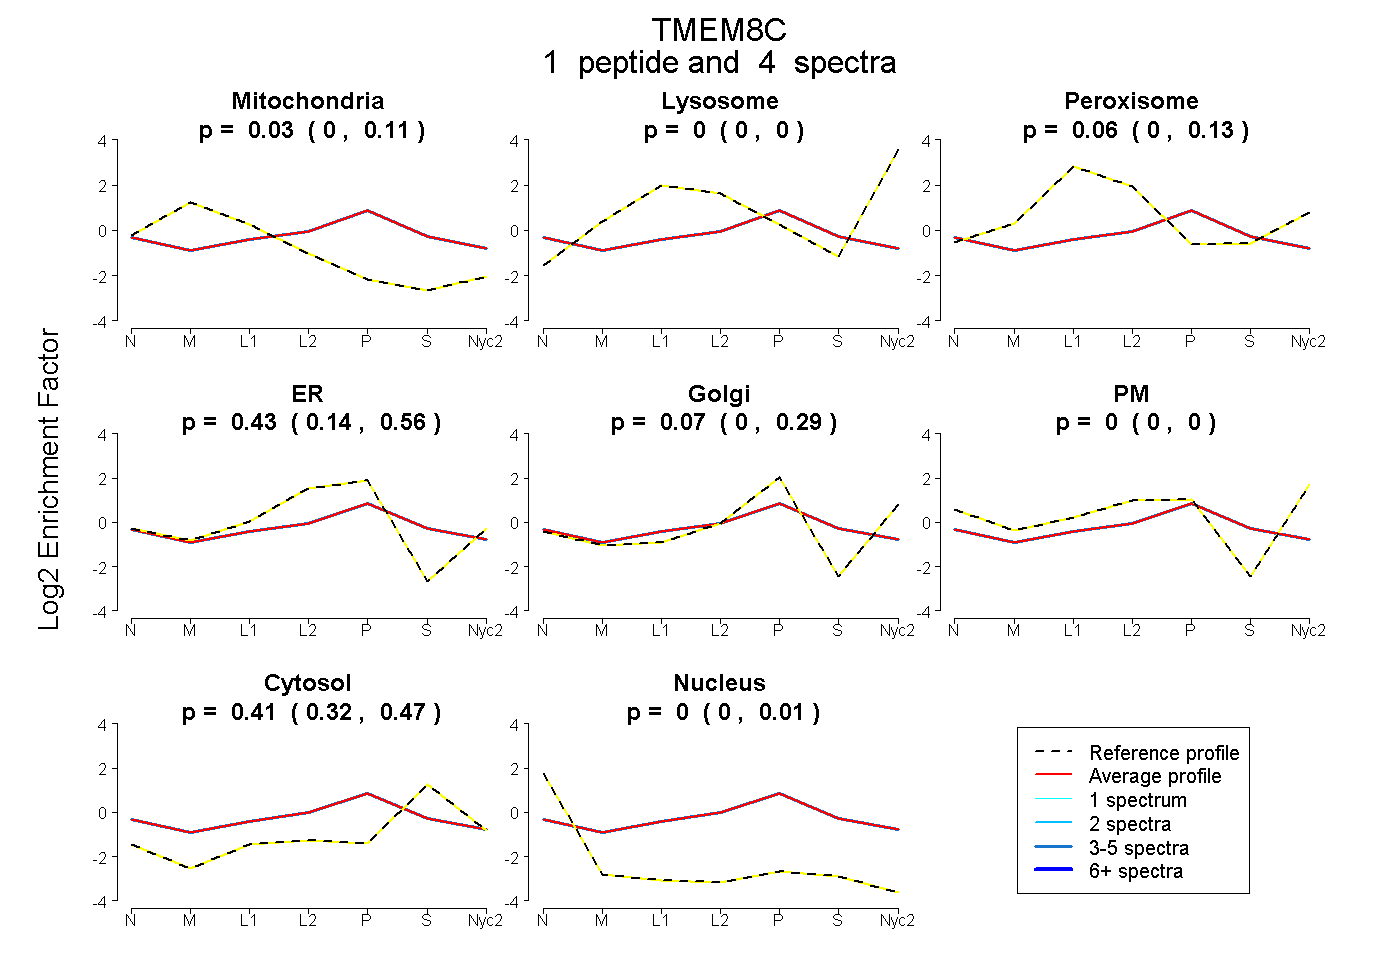
1 peptide |
4 spectra |
|
0.032 0.000 | 0.111 |
0.000 0.000 | 0.000 |
0.056 0.000 | 0.129 |
0.432 0.135 | 0.562 |
0.072 0.000 | 0.291 |
0.000 0.000 | 0.000 |
0.410 0.323 | 0.467 |
0.000 0.000 | 0.007 |