 5
5peptides
spectra
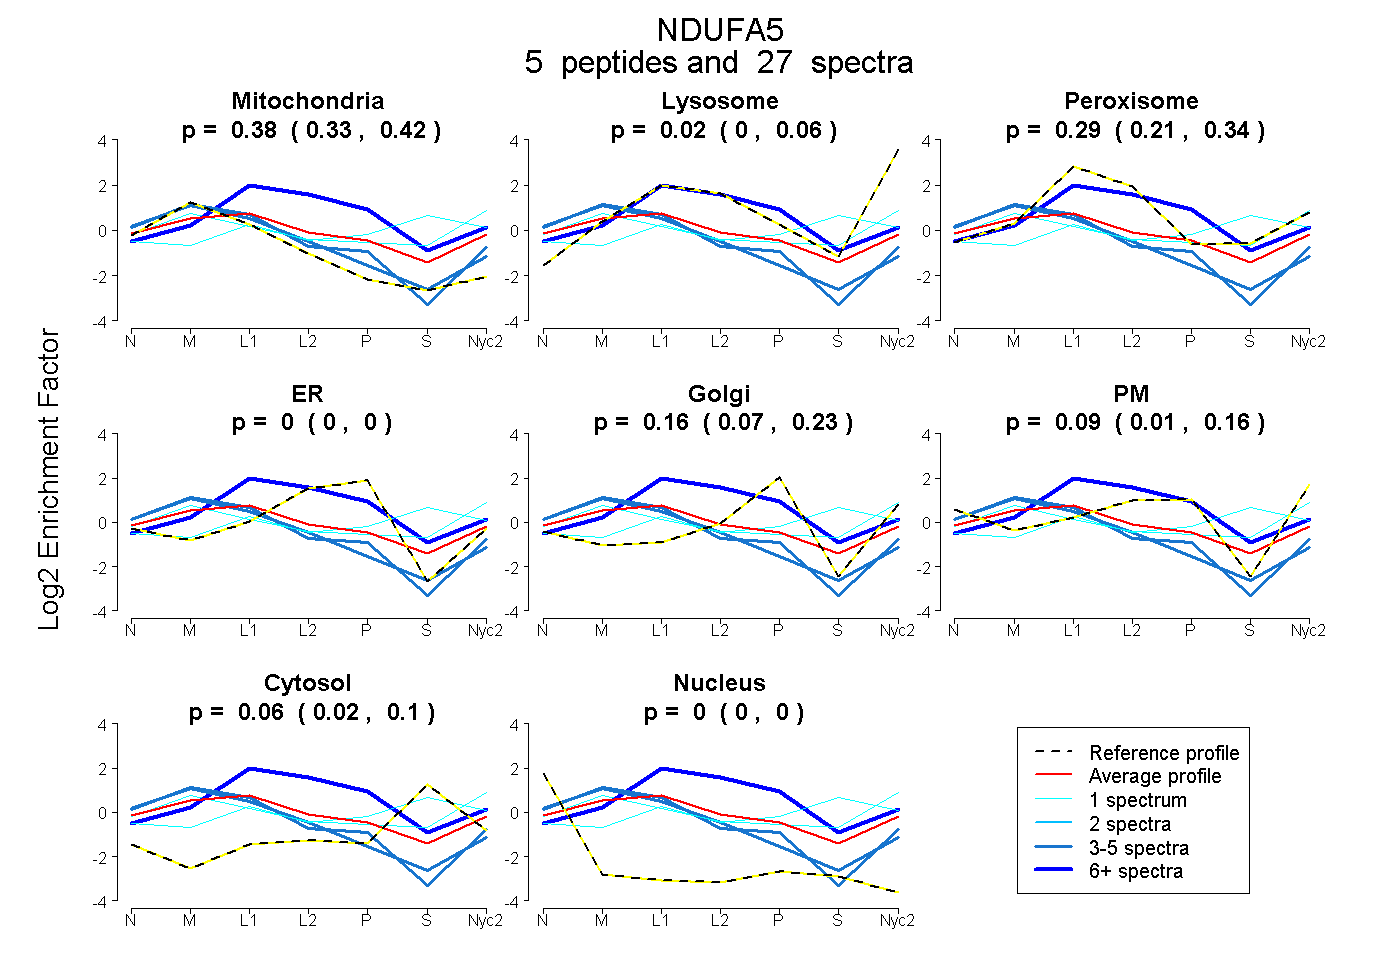
0.334 | 0.415
0.000 | 0.057
0.213 | 0.336
0.000 | 0.000
0.070 | 0.235
0.011 | 0.160
0.018 | 0.101
0.000 | 0.000
5peptides
spectra
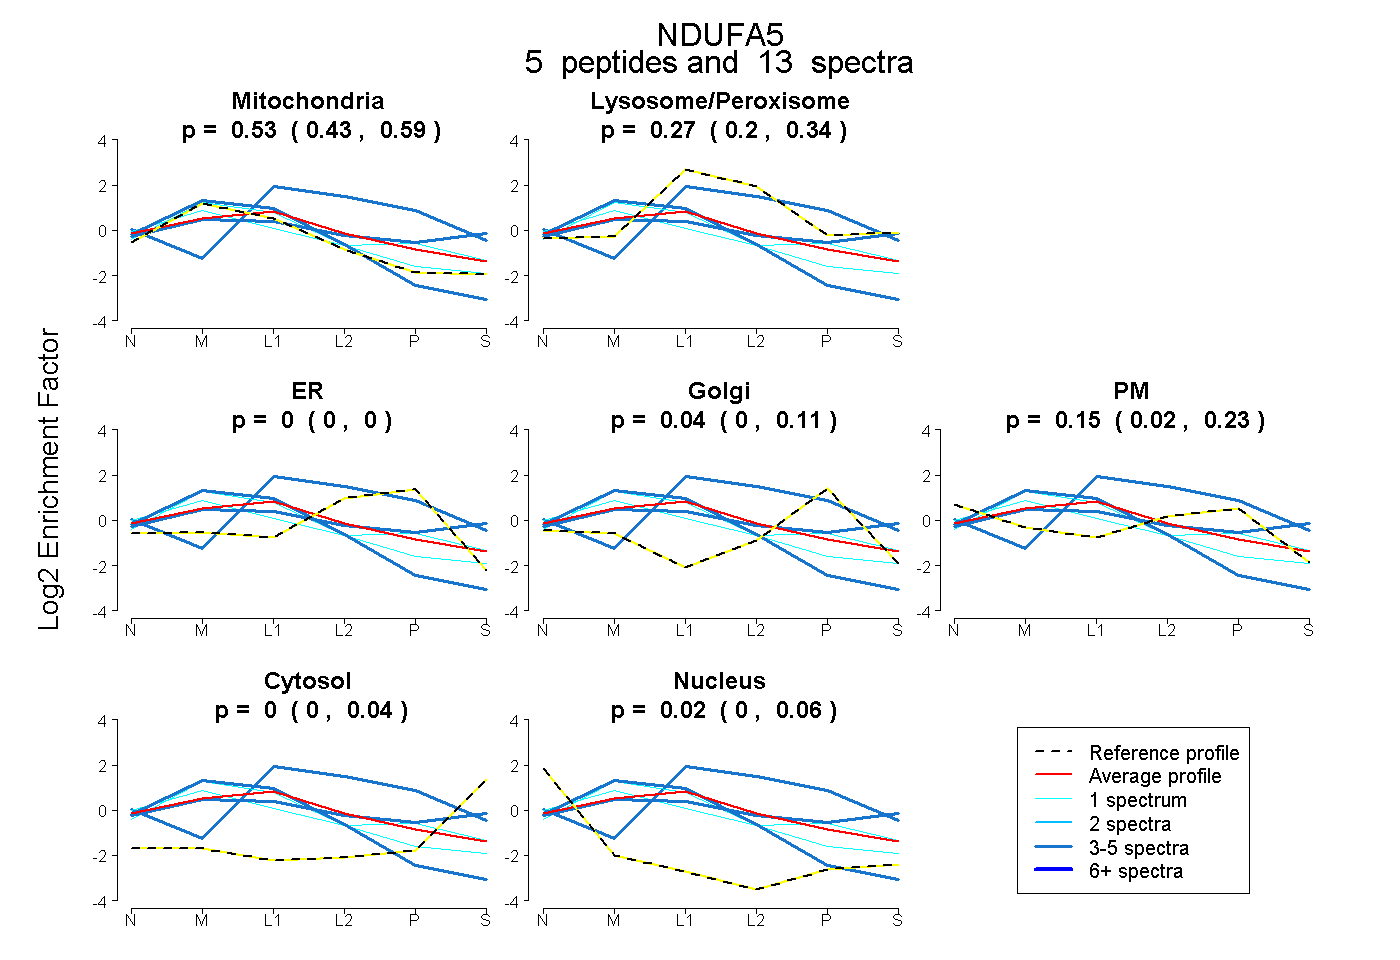
0.428 | 0.590
0.201 | 0.337
0.000 | 0.000
0.000 | 0.113
0.016 | 0.228
0.000 | 0.039
0.000 | 0.064
6peptides
spectra
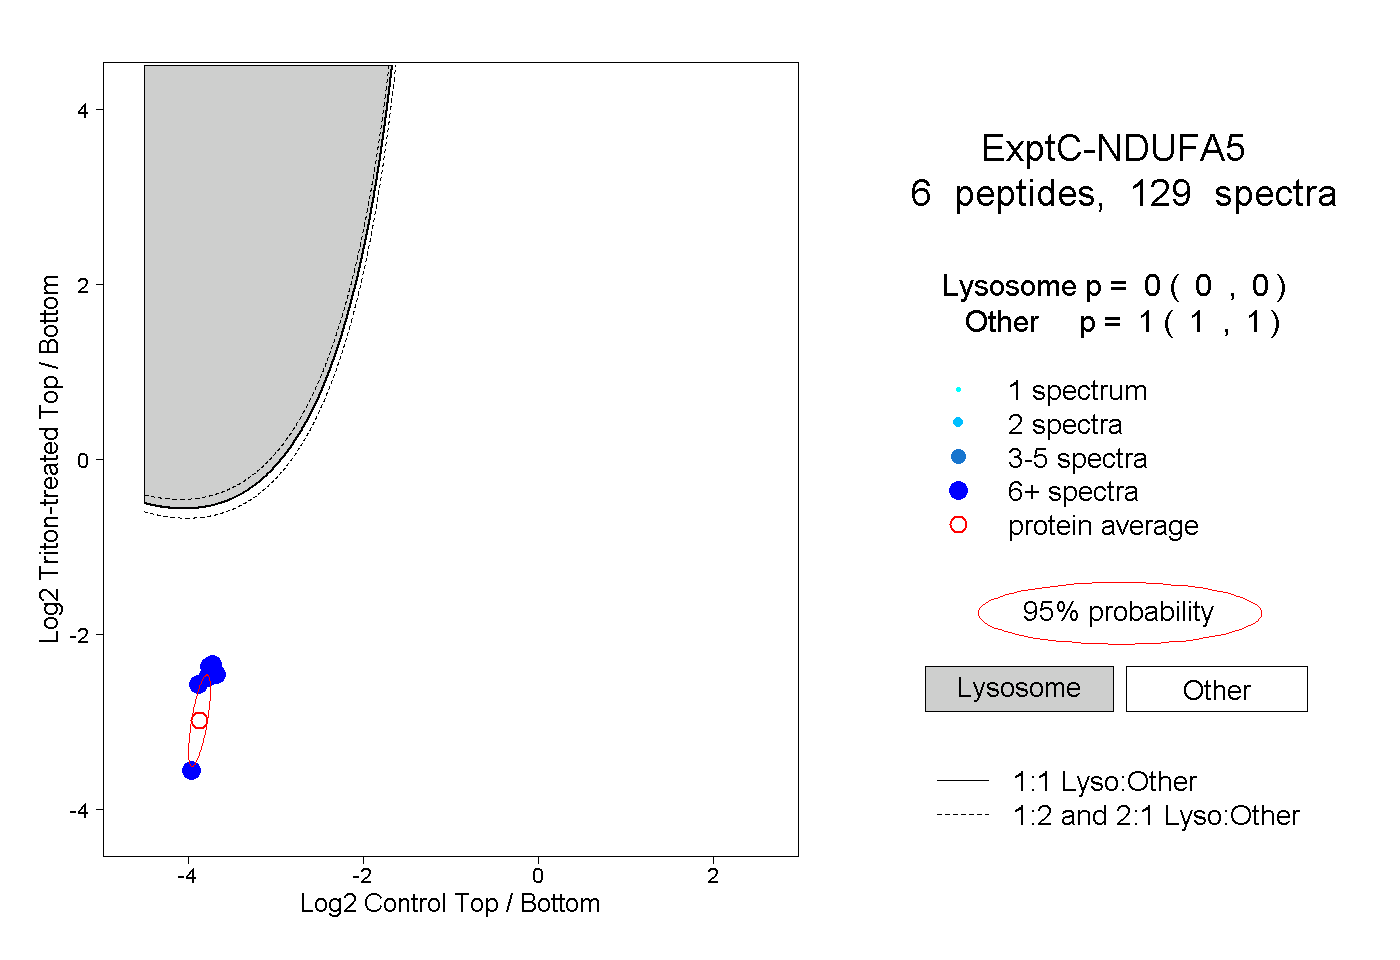
0.000 | 0.000
1.000 | 1.000
5peptides
spectra

0.000 | 0.002
0.998 | 1.000