 11
11peptides
spectra
0.000 | 0.000
0.000 | 0.000
0.227 | 0.251
0.000 | 0.000
0.000 | 0.000
0.564 | 0.588
0.084 | 0.110
0.076 | 0.091
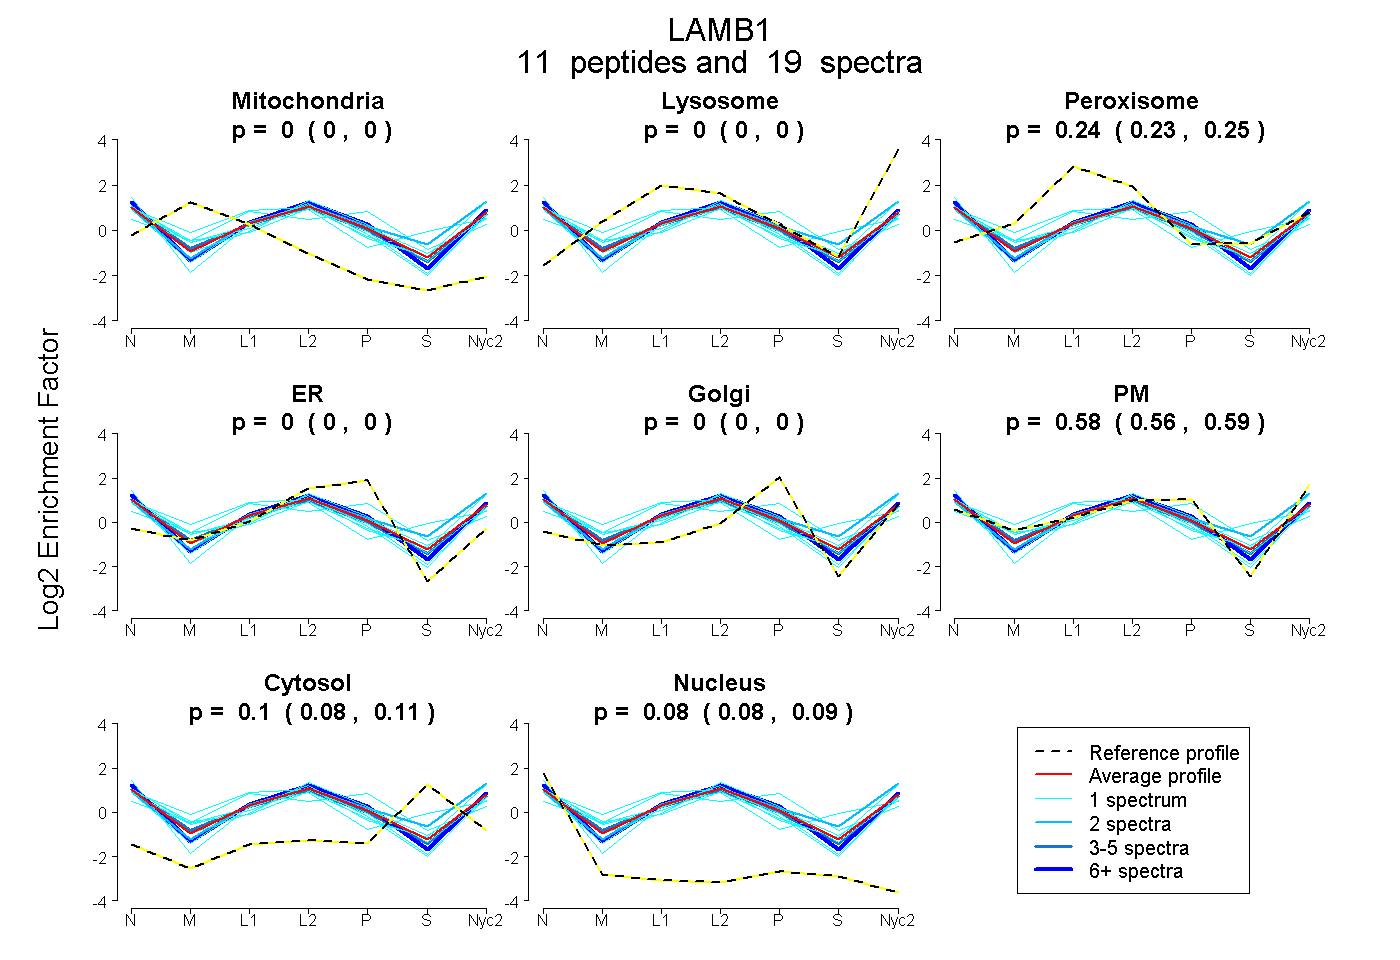
| Plot | Mito | Lyso | Perox | ER | Golgi | PM | Cytosol | Nucleus | |||||
| Expt A |
11 peptides |
19 spectra |
|
0.000 0.000 | 0.000 |
0.000 0.000 | 0.000 |
0.240 0.227 | 0.251 |
0.000 0.000 | 0.000 |
0.000 0.000 | 0.000 |
0.577 0.564 | 0.588 |
0.098 0.084 | 0.110 |
0.084 0.076 | 0.091 |
| 1 spectrum, AQVAAEK | 0.000 | 0.000 | 0.404 | 0.041 | 0.264 | 0.160 | 0.078 | 0.054 | ||
| 1 spectrum, NIGILFEEAEK | 0.000 | 0.000 | 0.167 | 0.037 | 0.000 | 0.625 | 0.084 | 0.086 | ||
| 1 spectrum, LQLLEDLER | 0.000 | 0.000 | 0.191 | 0.000 | 0.000 | 0.628 | 0.000 | 0.180 | ||
| 1 spectrum, LHVEGER | 0.045 | 0.000 | 0.335 | 0.000 | 0.000 | 0.530 | 0.000 | 0.090 | ||
| 1 spectrum, EGFYDLSAEDPFGCK | 0.000 | 0.000 | 0.368 | 0.000 | 0.000 | 0.274 | 0.284 | 0.074 | ||
| 1 spectrum, LLDELAGK | 0.000 | 0.000 | 0.242 | 0.000 | 0.000 | 0.557 | 0.091 | 0.110 | ||
| 1 spectrum, LHTLGDNLLDSR | 0.000 | 0.000 | 0.245 | 0.000 | 0.000 | 0.553 | 0.118 | 0.084 | ||
| 2 spectra, IEDPYSPR | 0.000 | 0.000 | 0.186 | 0.000 | 0.000 | 0.597 | 0.216 | 0.000 | ||
| 3 spectra, AELLLEEAK | 0.000 | 0.000 | 0.257 | 0.000 | 0.000 | 0.569 | 0.056 | 0.117 | ||
| 1 spectrum, TVNELAEQLEFIK | 0.000 | 0.000 | 0.263 | 0.000 | 0.000 | 0.579 | 0.088 | 0.070 | ||
| 6 spectra, AVITVQRPGR | 0.000 | 0.000 | 0.191 | 0.000 | 0.000 | 0.670 | 0.027 | 0.112 |
| Plot | Mito | Lyso or Perox | ER | Golgi | PM | Cytosol | Nucleus | ||||||
| Expt B |
1 peptide |
1 spectrum |
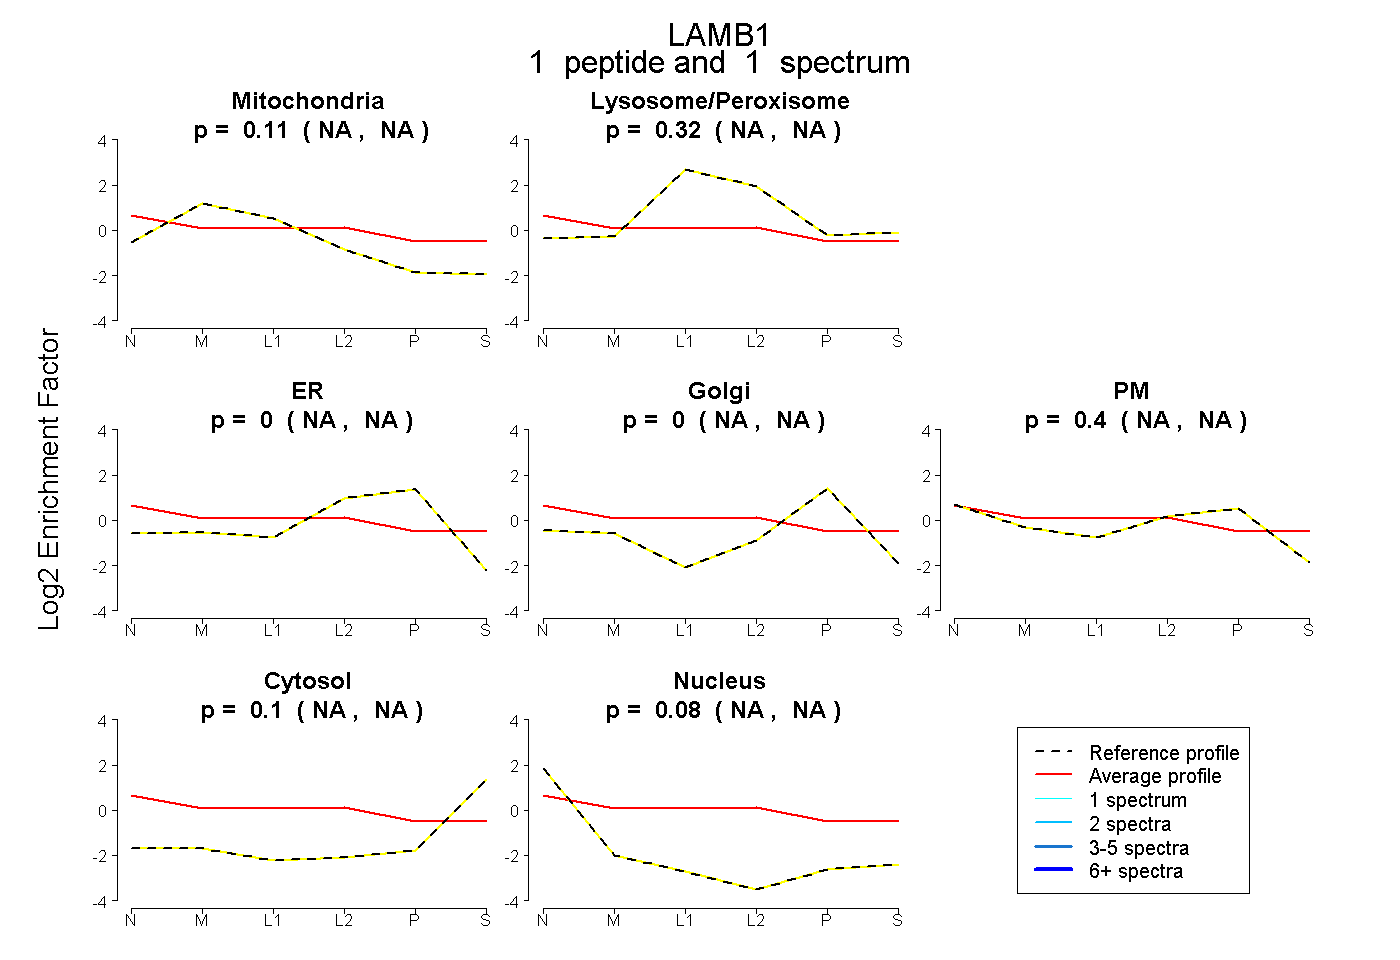 |
0.111 NA | NA |
0.320 NA | NA |
0.000 NA | NA |
0.000 NA | NA |
0.397 NA | NA |
0.097 NA | NA |
0.076 NA | NA |
|||
| Plot | Lyso | Other | |||||||||||
| Expt C |
11 peptides |
17 spectra |
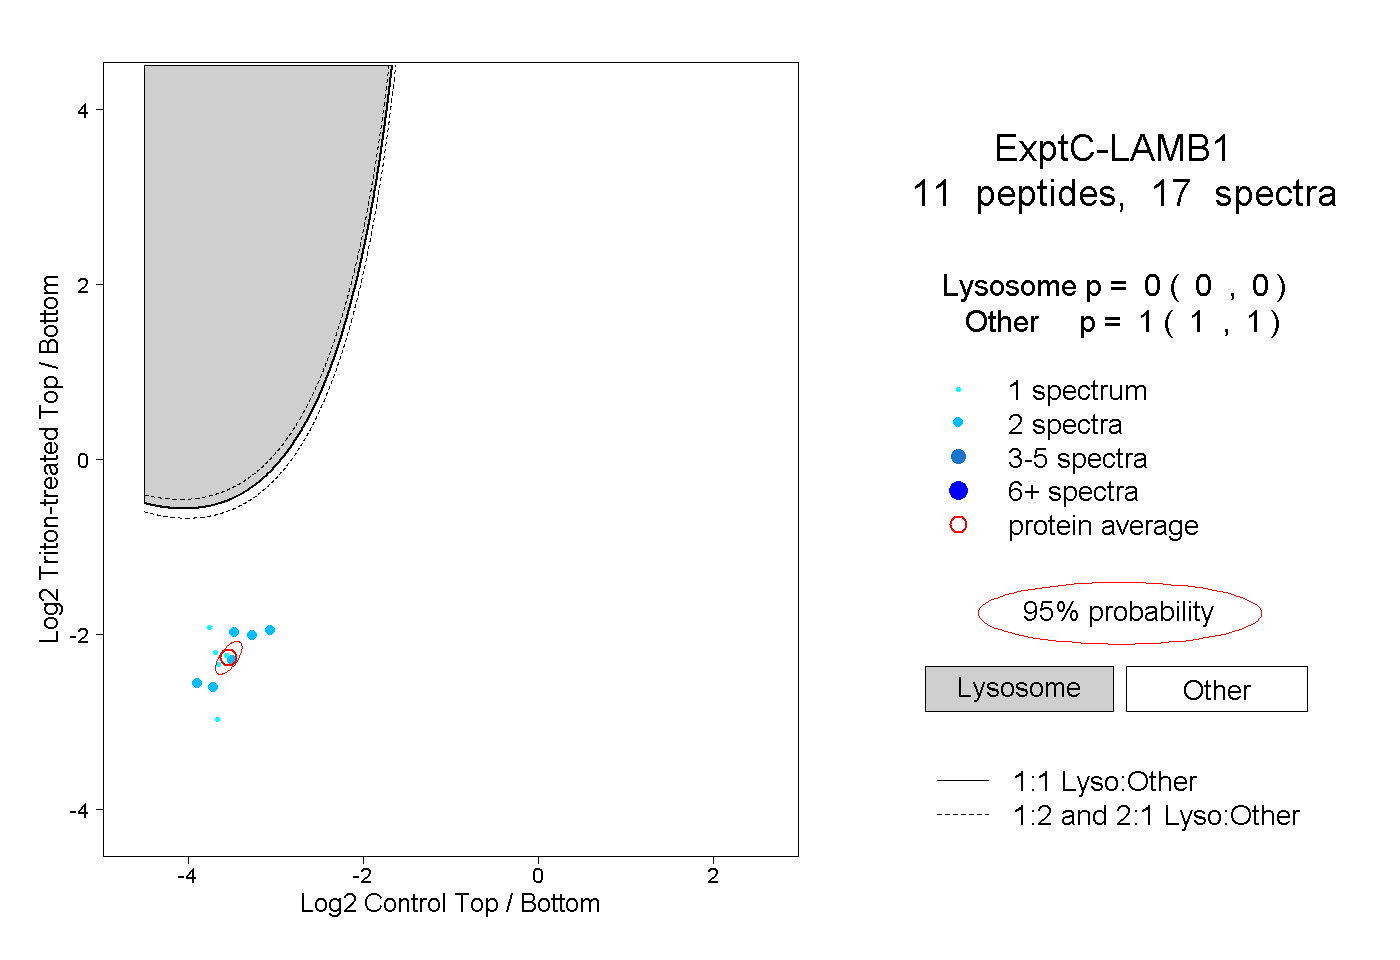 |
0.000 0.000 | 0.000 |
1.000 1.000 | 1.000 |
||||||||
| Plot | Lyso | Other | |||||||||||
| Expt D |
1 peptide |
2 spectra |
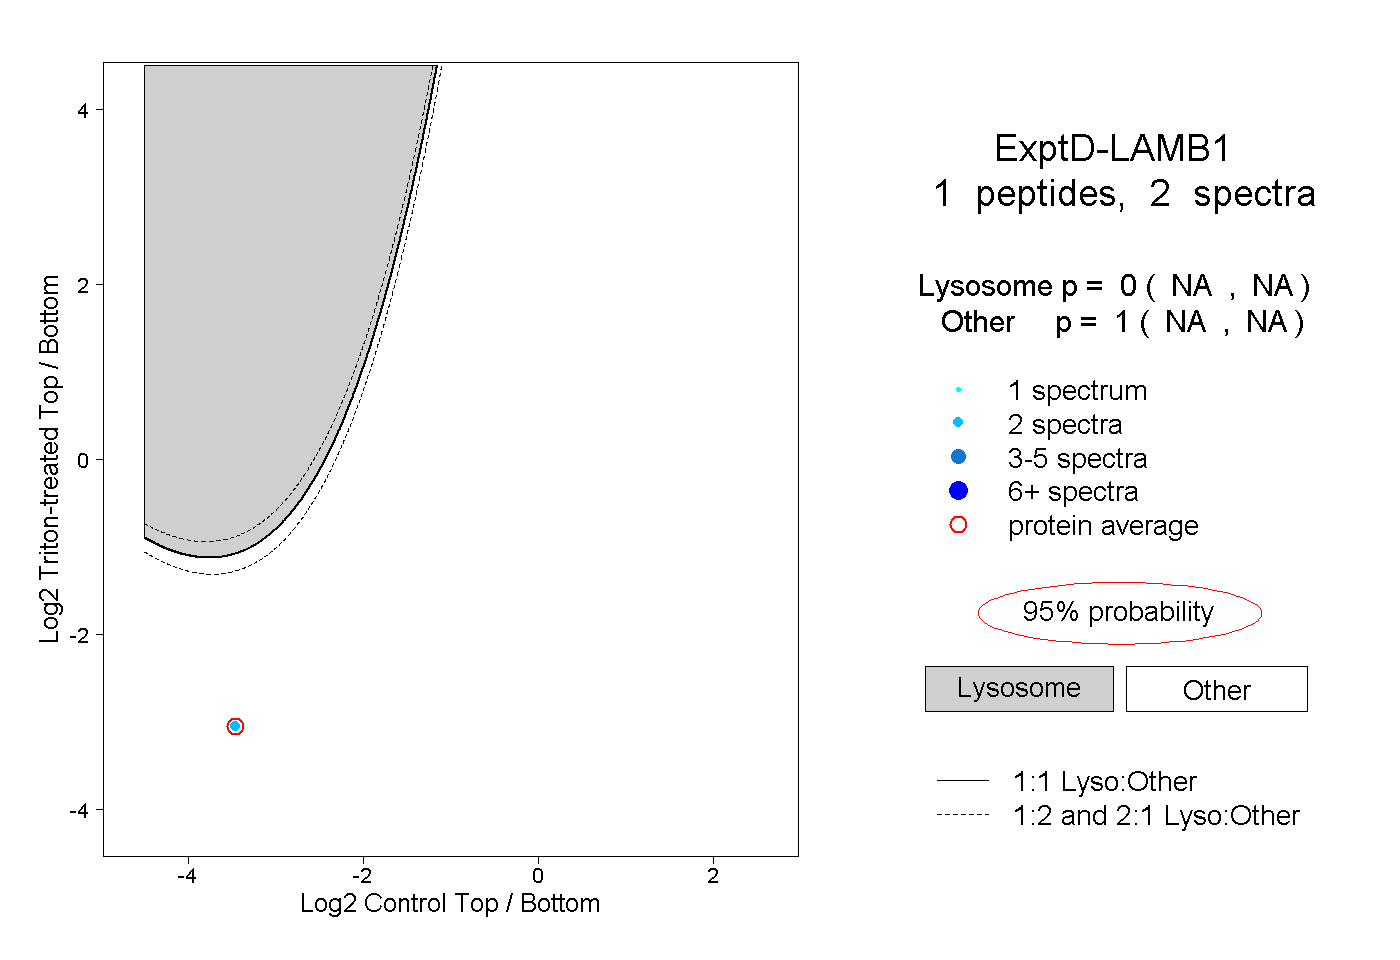 |
0.000 NA | NA |
1.000 NA | NA |