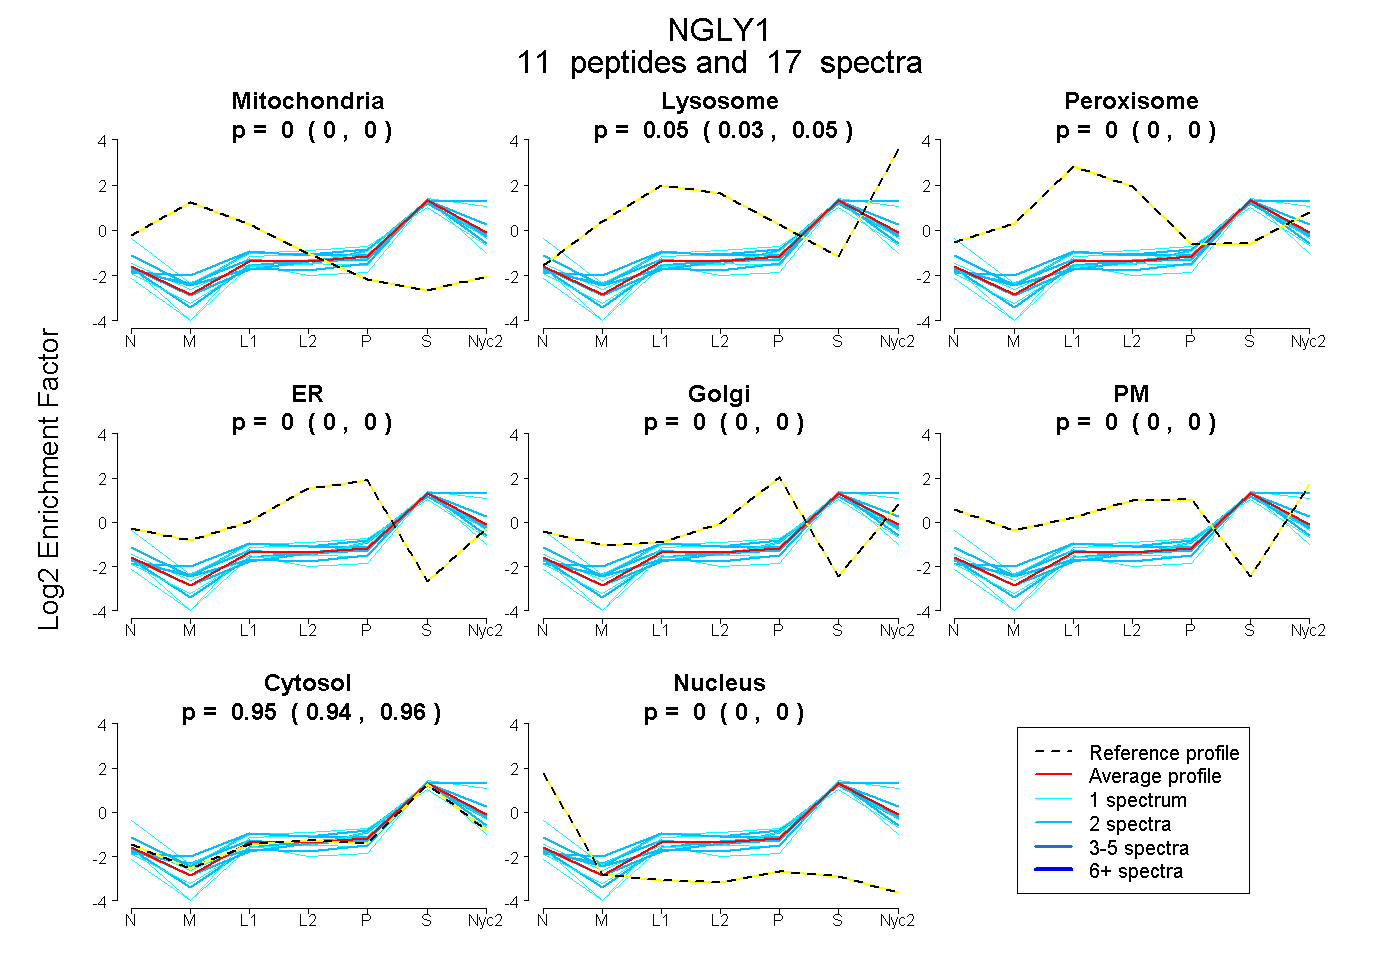
 11
11peptides
spectra
0.000 | 0.000
0.035 | 0.054
0.000 | 0.000
0.000 | 0.000
0.000 | 0.000
0.000 | 0.000
0.945 | 0.963
0.000 | 0.000
| Plot | Mito | Lyso | Perox | ER | Golgi | PM | Cytosol | Nucleus | |||||
| Expt A |
11 peptides |
17 spectra |
|
0.000 0.000 | 0.000 |
0.045 0.035 | 0.054 |
0.000 0.000 | 0.000 |
0.000 0.000 | 0.000 |
0.000 0.000 | 0.000 |
0.000 0.000 | 0.000 |
0.955 0.945 | 0.963 |
0.000 0.000 | 0.000 |
| 1 spectrum, QLLLSESR | 0.000 | 0.000 | 0.000 | 0.000 | 0.000 | 0.000 | 1.000 | 0.000 | ||
| 1 spectrum, NPSDEK | 0.000 | 0.000 | 0.000 | 0.000 | 0.000 | 0.000 | 1.000 | 0.000 | ||
| 2 spectra, TSSQSFETGSVR | 0.000 | 0.006 | 0.000 | 0.000 | 0.000 | 0.000 | 0.994 | 0.000 | ||
| 1 spectrum, IIVELVEFISPK | 0.000 | 0.000 | 0.000 | 0.000 | 0.000 | 0.000 | 0.952 | 0.048 | ||
| 2 spectra, YNNPEK | 0.000 | 0.000 | 0.000 | 0.000 | 0.000 | 0.000 | 1.000 | 0.000 | ||
| 1 spectrum, LLLTYADNILR | 0.000 | 0.100 | 0.000 | 0.000 | 0.000 | 0.000 | 0.900 | 0.000 | ||
| 1 spectrum, HEEVMSR | 0.000 | 0.000 | 0.023 | 0.006 | 0.000 | 0.138 | 0.807 | 0.025 | ||
| 2 spectra, DWNMVYLAR | 0.000 | 0.106 | 0.000 | 0.000 | 0.000 | 0.000 | 0.894 | 0.000 | ||
| 2 spectra, GETCLER | 0.000 | 0.072 | 0.000 | 0.000 | 0.020 | 0.032 | 0.875 | 0.000 | ||
| 2 spectra, IGNTAFSTR | 0.000 | 0.002 | 0.000 | 0.000 | 0.000 | 0.000 | 0.998 | 0.000 | ||
| 2 spectra, MESIFR | 0.000 | 0.242 | 0.000 | 0.000 | 0.000 | 0.000 | 0.758 | 0.000 |
| Plot | Mito | Lyso or Perox | ER | Golgi | PM | Cytosol | Nucleus | ||||||
| Expt B |
4 peptides |
7 spectra |
 |
0.000 0.000 | 0.000 |
0.000 0.000 | 0.061 |
0.000 0.000 | 0.000 |
0.067 0.009 | 0.082 |
0.000 0.000 | 0.000 |
0.933 0.897 | 0.953 |
0.000 0.000 | 0.011 |
|||
| Plot | Lyso | Other | |||||||||||
| Expt C |
9 peptides |
23 spectra |
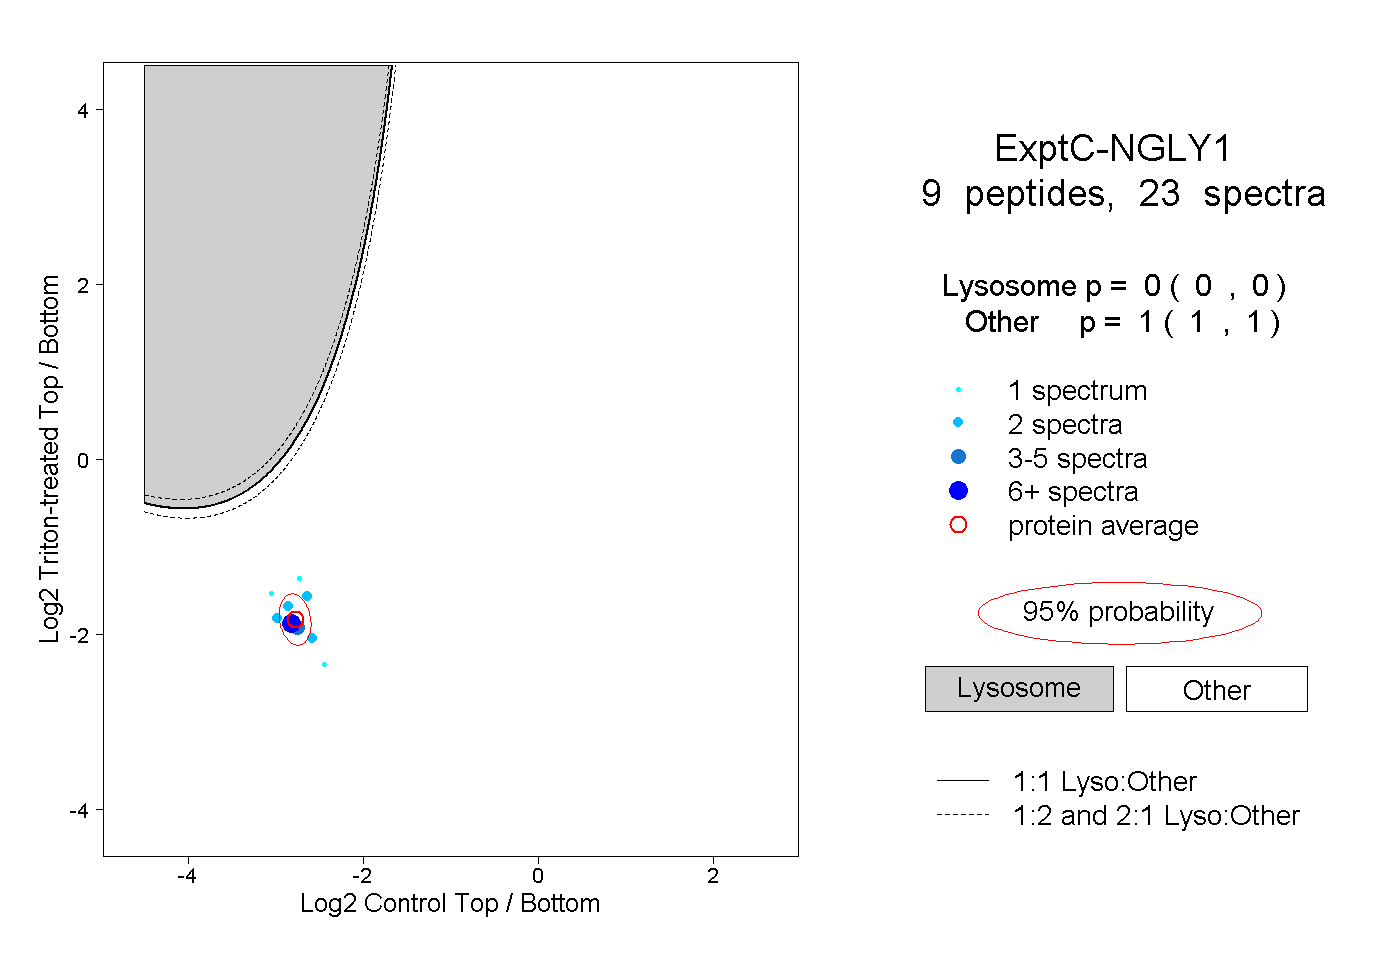 |
0.000 0.000 | 0.000 |
1.000 1.000 | 1.000 |
||||||||
| Plot | Lyso | Other | |||||||||||
| Expt D |
1 peptide |
3 spectra |
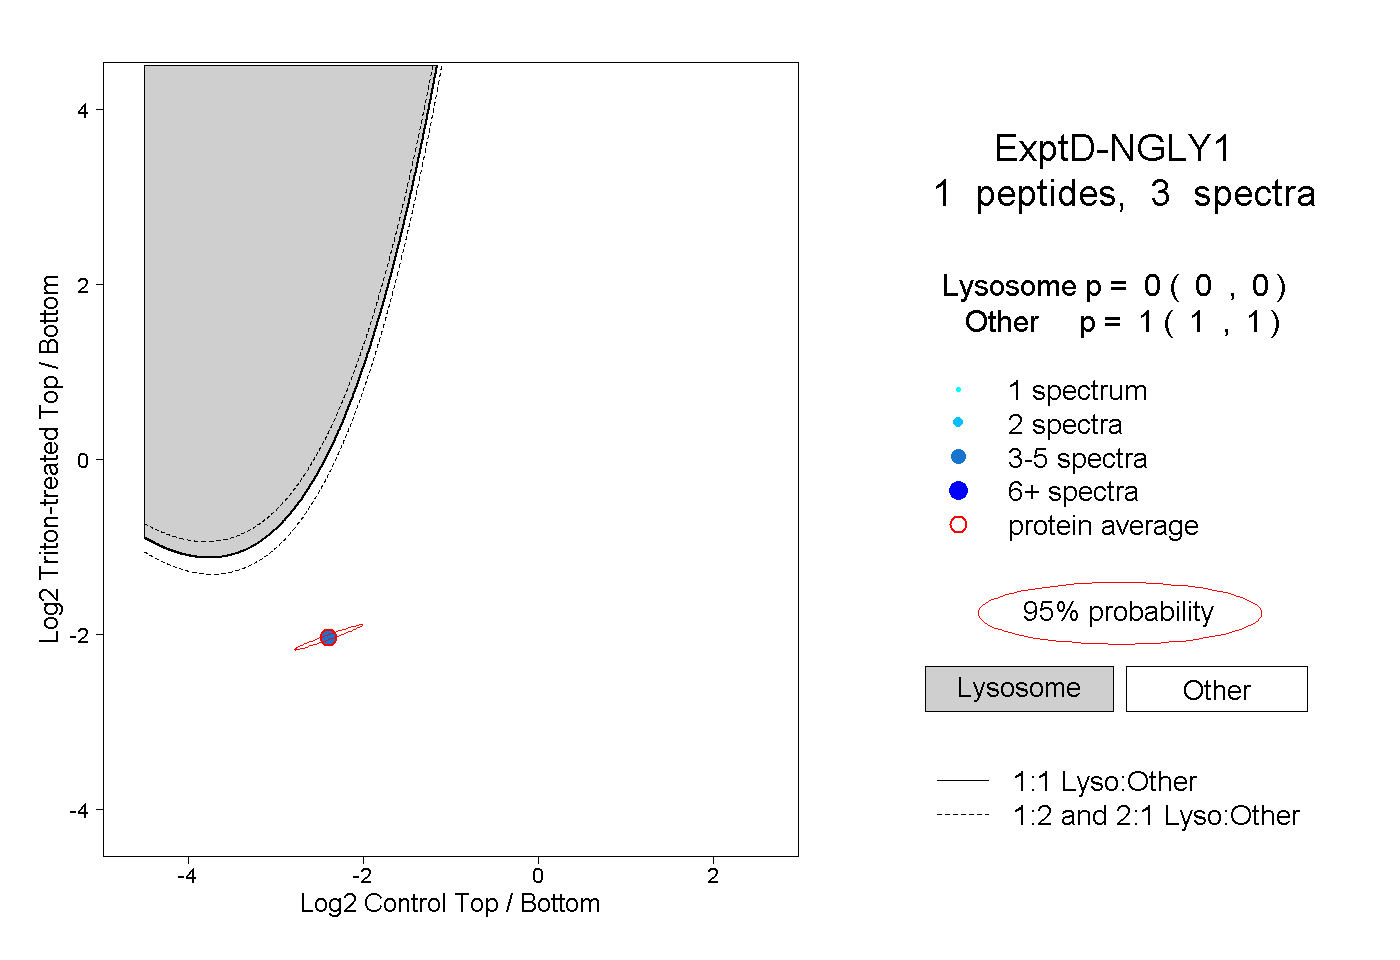 |
0.000 0.000 | 0.000 |
1.000 1.000 | 1.000 |