LGALSL
[ENSRNOP00000008274]
Main page
| | | Plot |
Mito |
Lyso |
|
Perox |
ER |
Golgi |
PM |
Cytosol |
Nucleus |
|
| Expt A |
 5
5
peptides |
10
spectra |
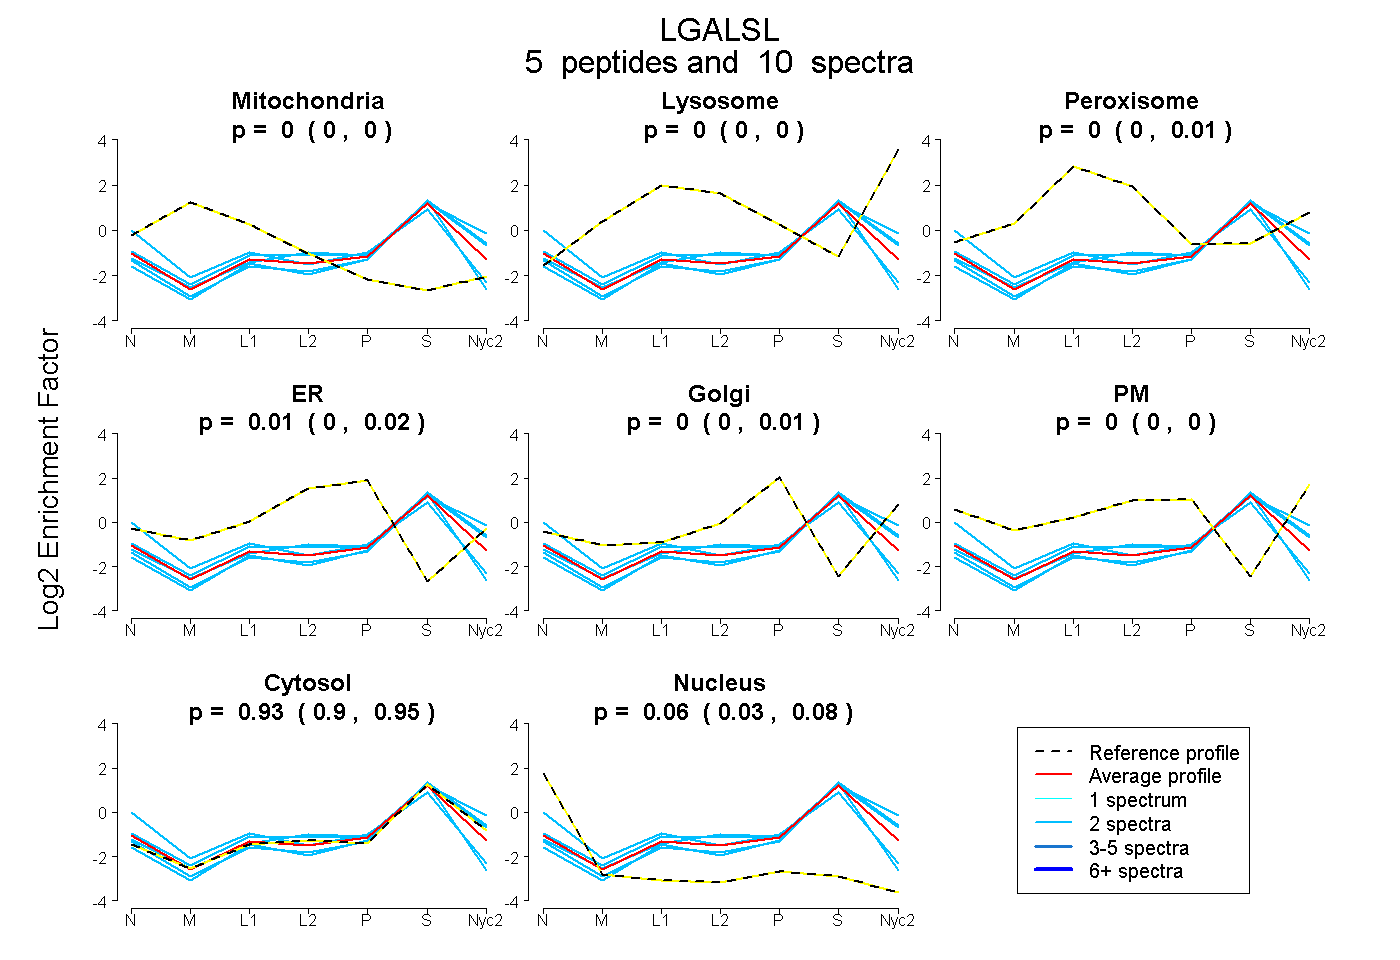 |
0.000
0.000 | 0.000 |
0.000
0.000 | 0.000 |
|
0.000
0.000 | 0.012 |
0.010
0.000 | 0.018 |
0.000
0.000 | 0.012 |
0.000
0.000 | 0.000 |
0.931
0.905 | 0.947 |
0.058
0.033 | 0.082 |
|
| | | Plot |
Mito |
|
Lyso or Perox |
|
ER |
Golgi |
PM |
Cytosol |
Nucleus |
|
| Expt B |
4
peptides |
6
spectra |
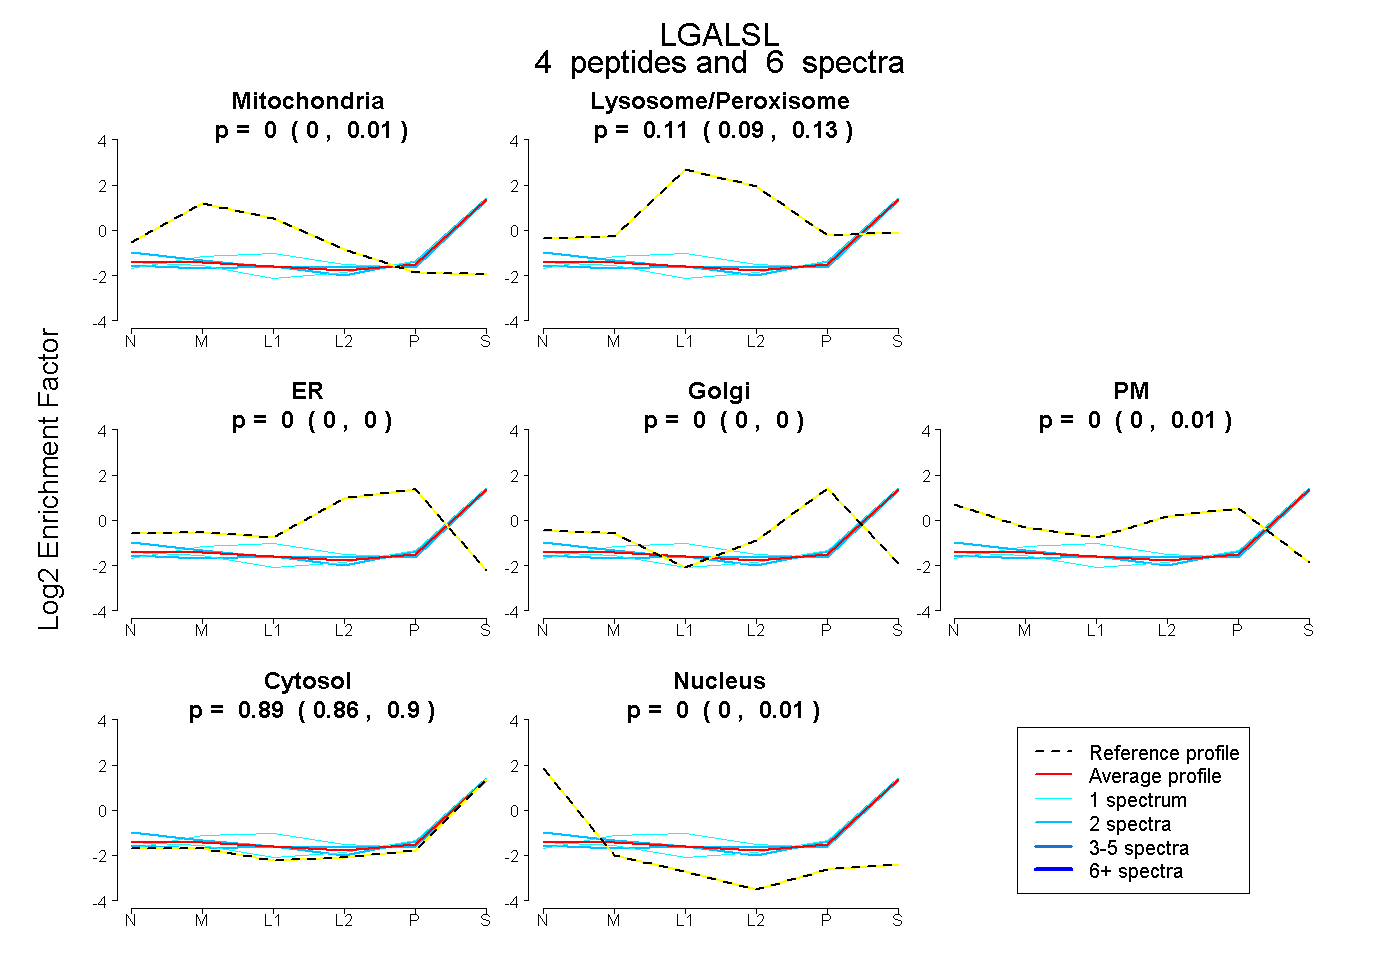 |
0.000
0.000 | 0.006 |
|
0.112
0.085 | 0.127 |
|
0.000
0.000 | 0.000 |
0.000
0.000 | 0.000 |
0.000
0.000 | 0.013 |
0.887
0.864 | 0.899 |
0.001
0.000 | 0.014 |
|
| 1 spectrum, LIVPFCGHIK |
0.011 |
|
0.181 |
|
0.000 |
0.000 |
0.000 |
0.808 |
0.000 |
|
| 2 spectra, AVFTDR |
0.000 |
|
0.084 |
|
0.000 |
0.000 |
0.000 |
0.916 |
0.000 |
|
| 2 spectra, VEILCEHPR |
0.000 |
|
0.131 |
|
0.000 |
0.000 |
0.000 |
0.817 |
0.052 |
|
| 1 spectrum, IQTLSAIDTIK |
0.000 |
|
0.033 |
|
0.000 |
0.054 |
0.000 |
0.913 |
0.000 |
|