 3
3peptides
spectra
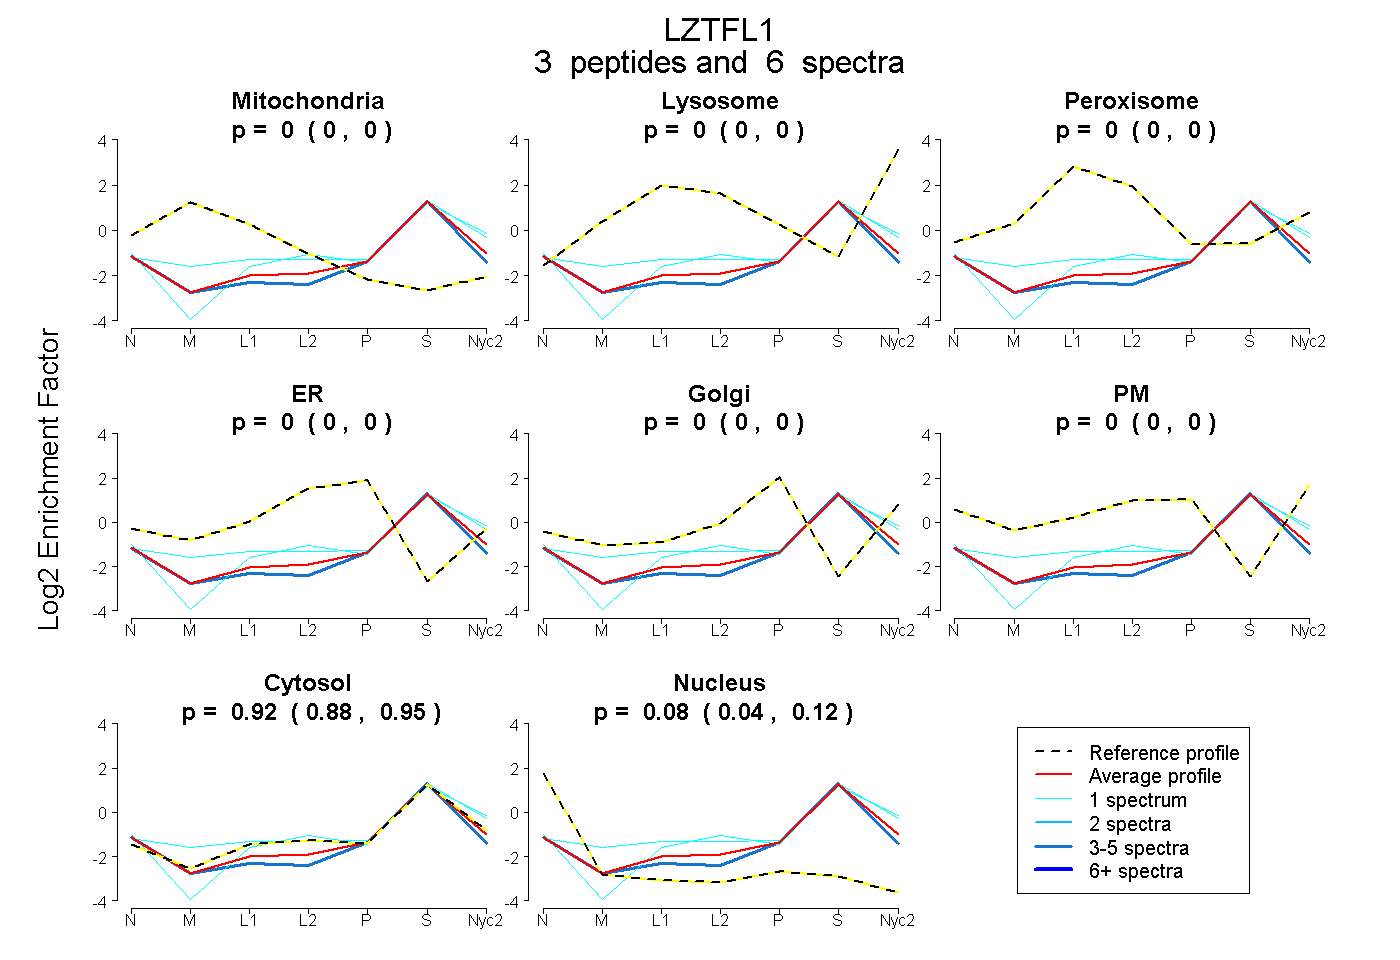
0.000 | 0.000
0.000 | 0.000
0.000 | 0.000
0.000 | 0.000
0.000 | 0.000
0.000 | 0.000
0.879 | 0.950
0.042 | 0.115
2peptides
spectra
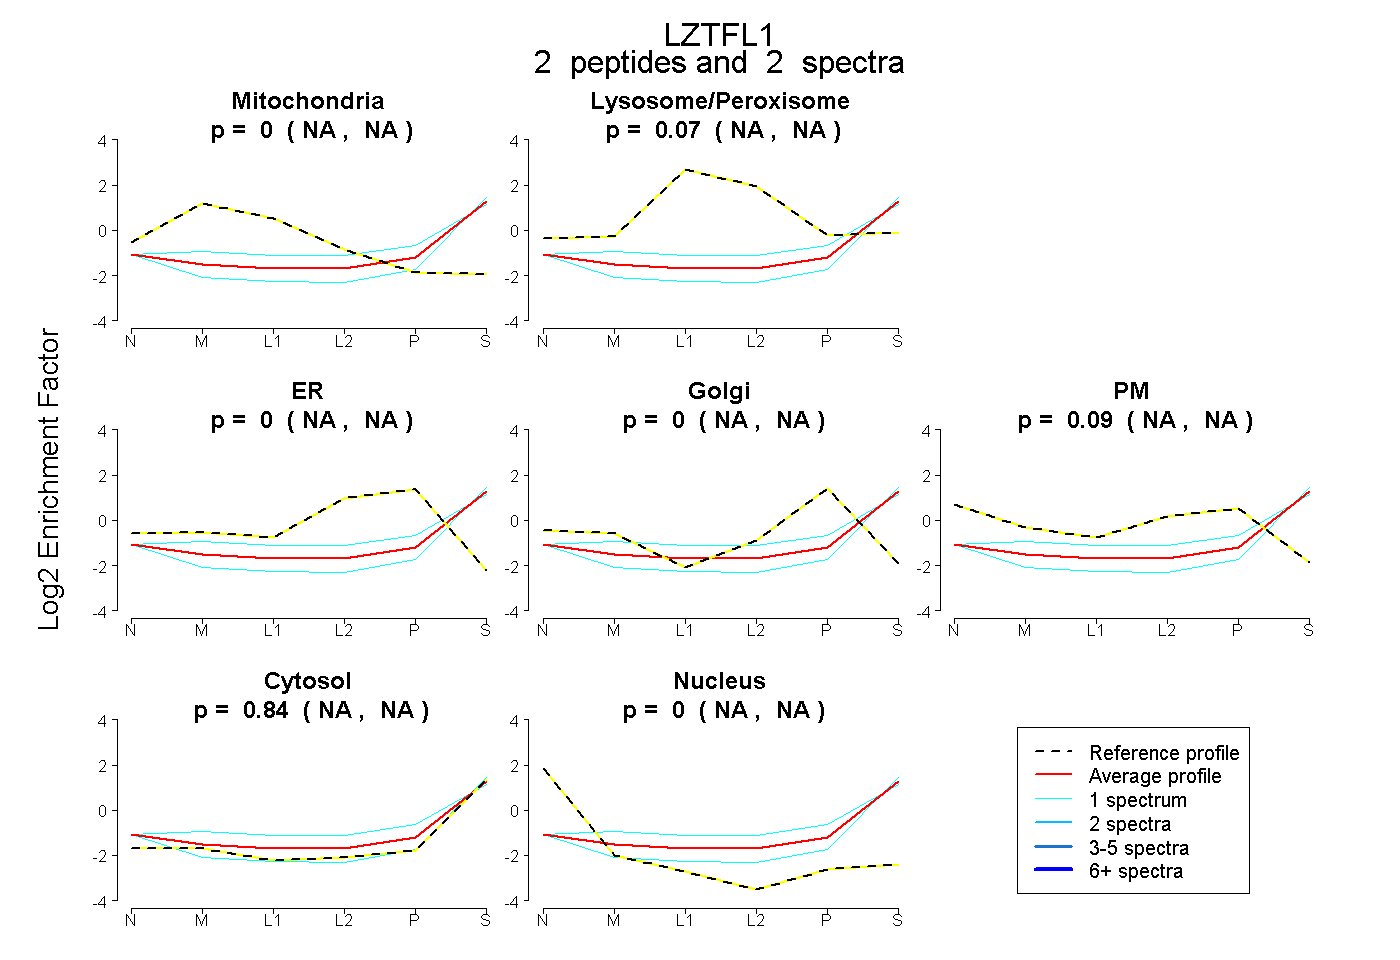
NA | NA
NA | NA
NA | NA
NA | NA
NA | NA
NA | NA
NA | NA
| Plot | Mito | Lyso | Perox | ER | Golgi | PM | Cytosol | Nucleus | |||||
| Expt A |
3 peptides |
6 spectra |
|
0.000 0.000 | 0.000 |
0.000 0.000 | 0.000 |
0.000 0.000 | 0.000 |
0.000 0.000 | 0.000 |
0.000 0.000 | 0.000 |
0.000 0.000 | 0.000 |
0.917 0.879 | 0.950 |
0.083 0.042 | 0.115 |
||
| Plot | Mito | Lyso or Perox | ER | Golgi | PM | Cytosol | Nucleus | ||||||
| Expt B |
2 peptides |
2 spectra |
|
0.000 NA | NA |
0.074 NA | NA |
0.000 NA | NA |
0.000 NA | NA |
0.090 NA | NA |
0.835 NA | NA |
0.000 NA | NA |
| 1 spectrum, ELLEQVAEFEK | 0.000 | 0.000 | 0.000 | 0.000 | 0.000 | 0.919 | 0.081 | |||
| 1 spectrum, TIETQAVNALDEK | 0.000 | 0.229 | 0.000 | 0.120 | 0.000 | 0.651 | 0.000 |
| Plot | Lyso | Other | |||||||||||
| Expt C |
1 peptide |
2 spectra |
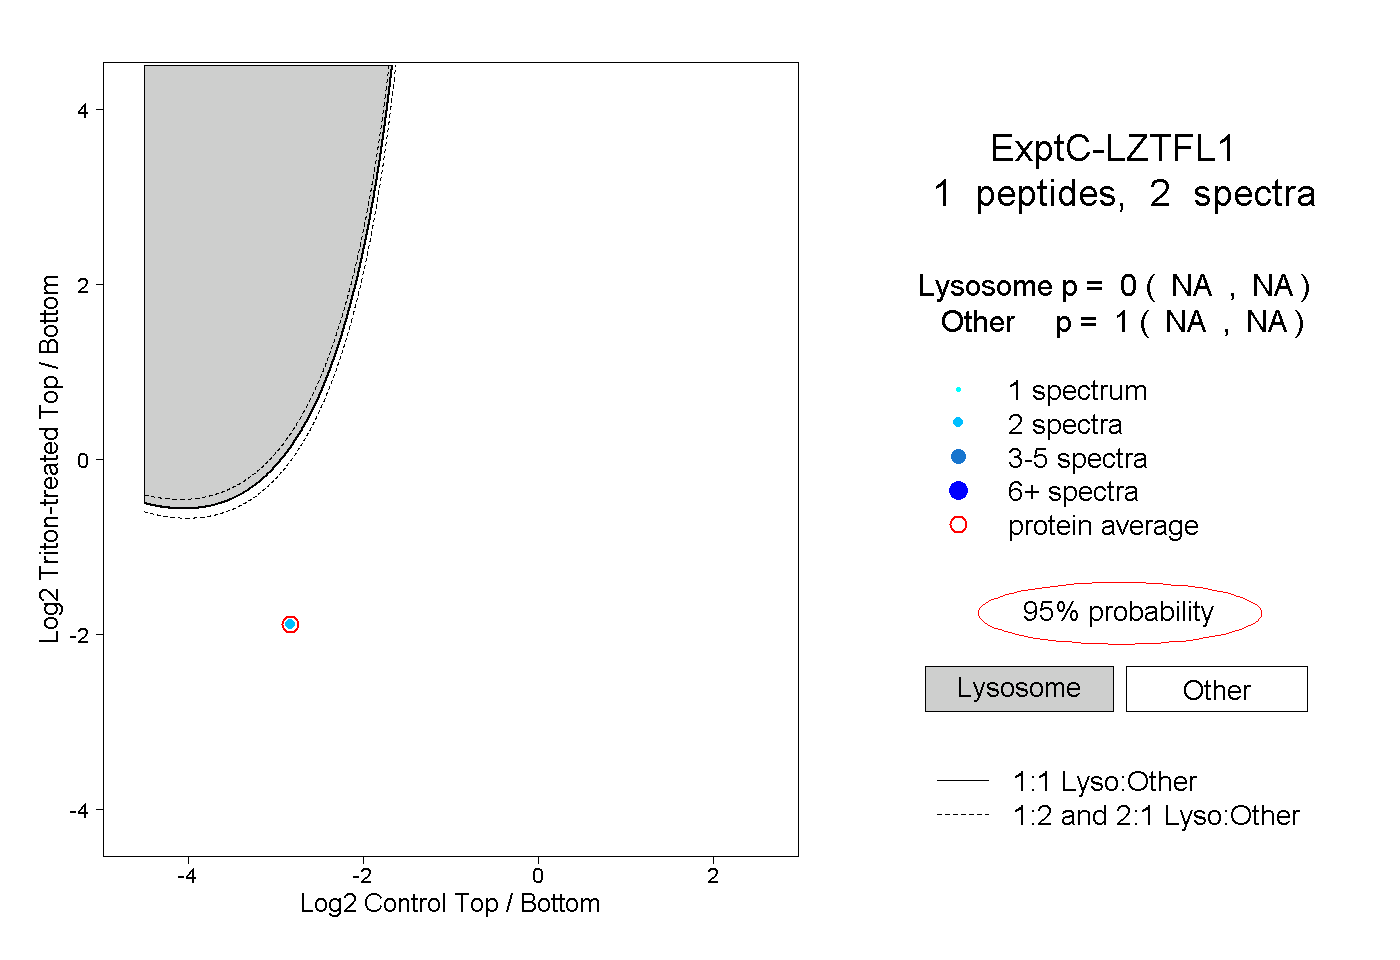 |
0.000 NA | NA |
1.000 NA | NA |