 2
2peptides
spectra
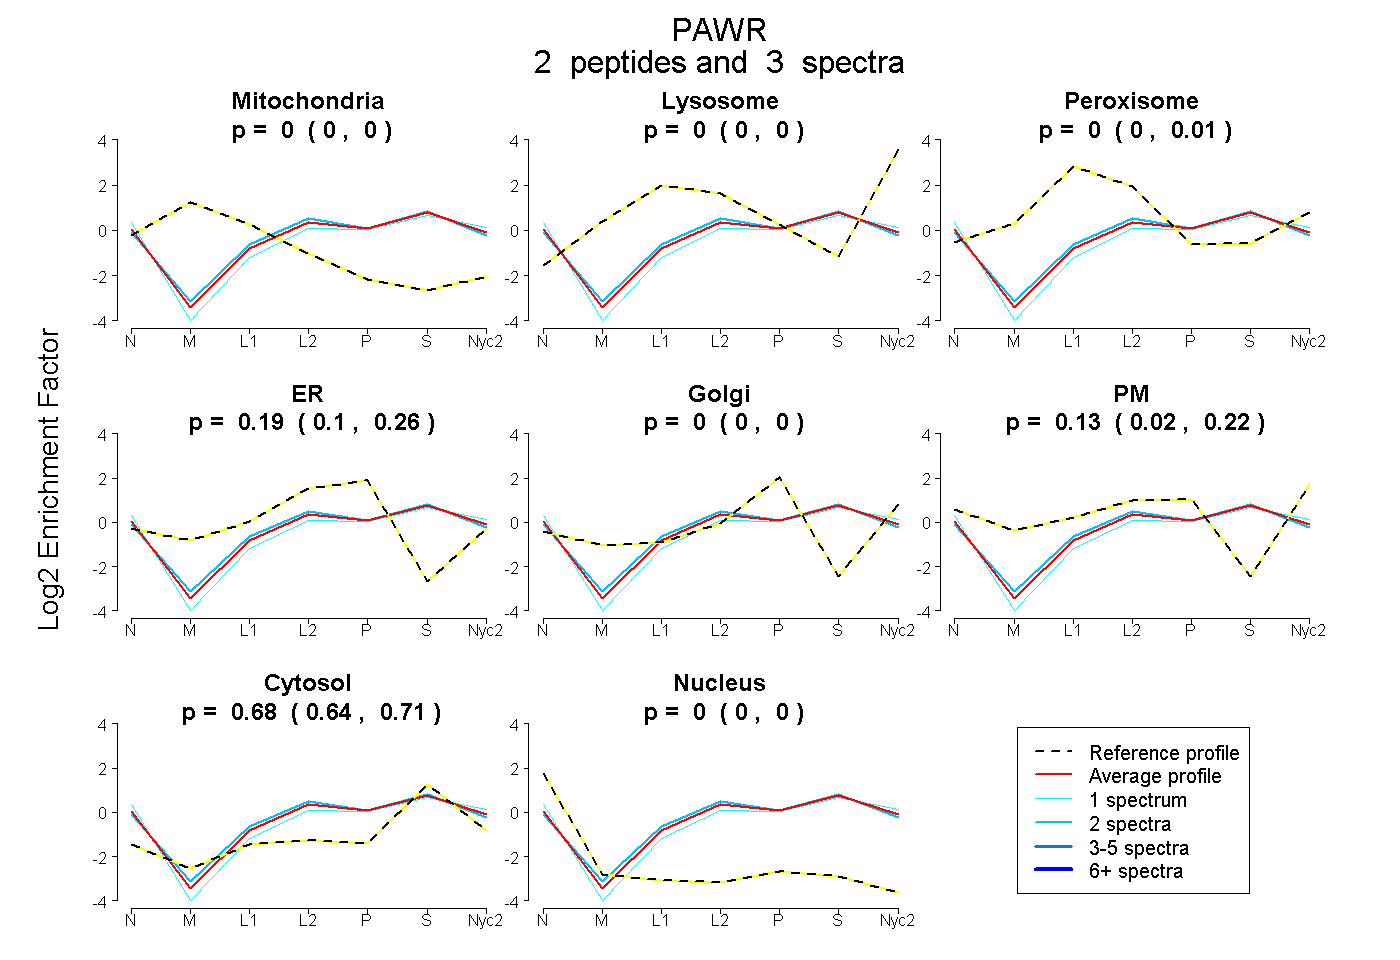
0.000 | 0.000
0.000 | 0.000
0.000 | 0.008
0.100 | 0.260
0.000 | 0.000
0.024 | 0.216
0.639 | 0.714
0.000 | 0.000
2peptides
spectra
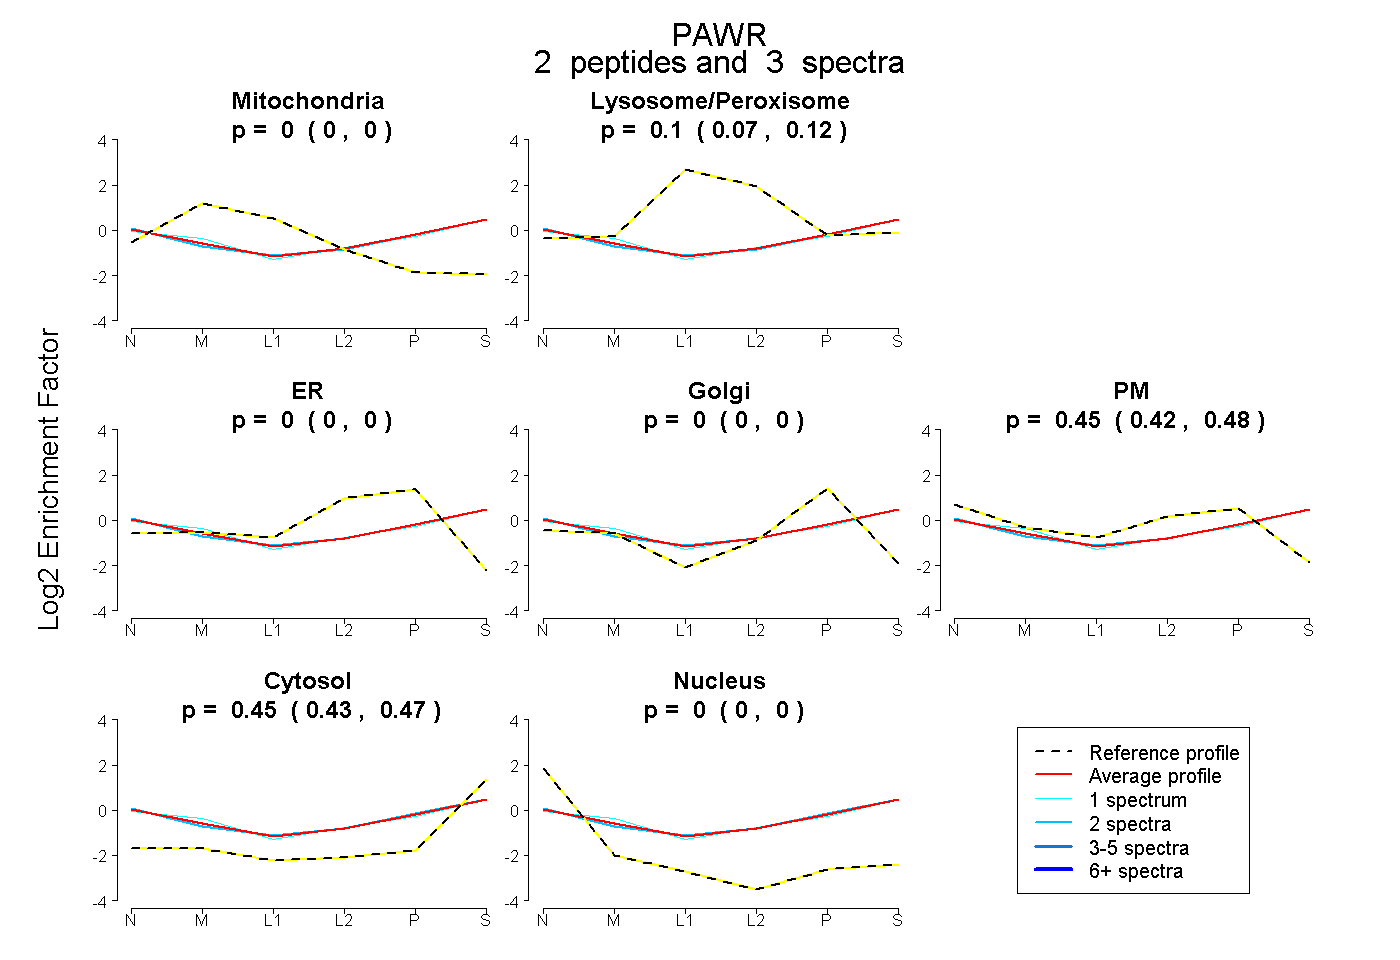
0.000 | 0.000
0.071 | 0.120
0.000 | 0.000
0.000 | 0.000
0.416 | 0.477
0.428 | 0.472
0.000 | 0.000
3peptides
spectra
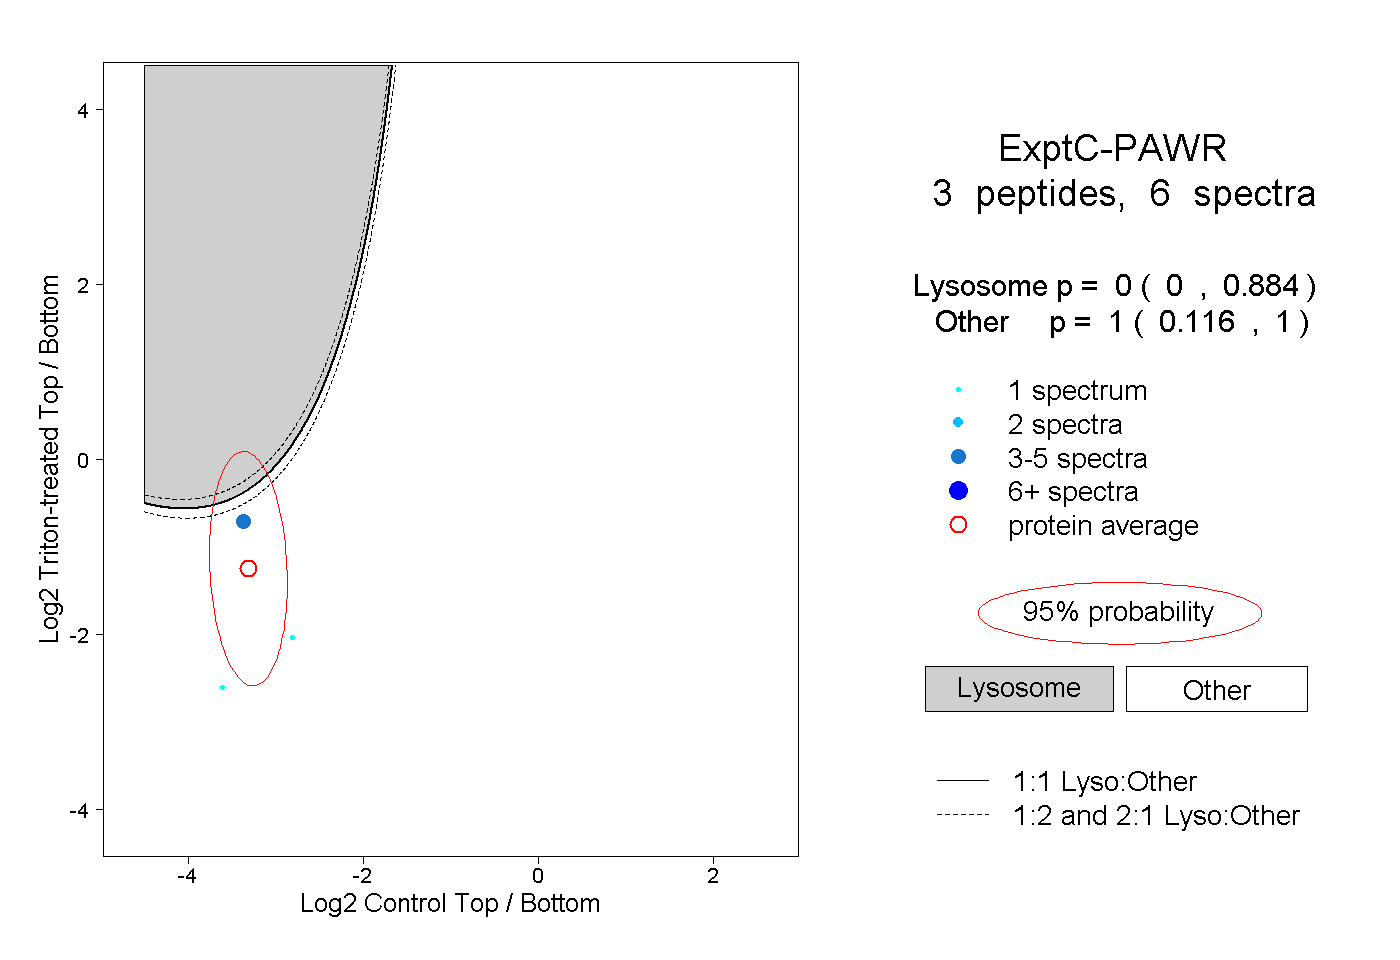
0.000 | 0.884
0.116 | 1.000