 14
14peptides
spectra
0.000 | 0.000
1.000 | 1.000
0.000 | 0.000
0.000 | 0.000
0.000 | 0.000
0.000 | 0.000
0.000 | 0.000
0.000 | 0.000
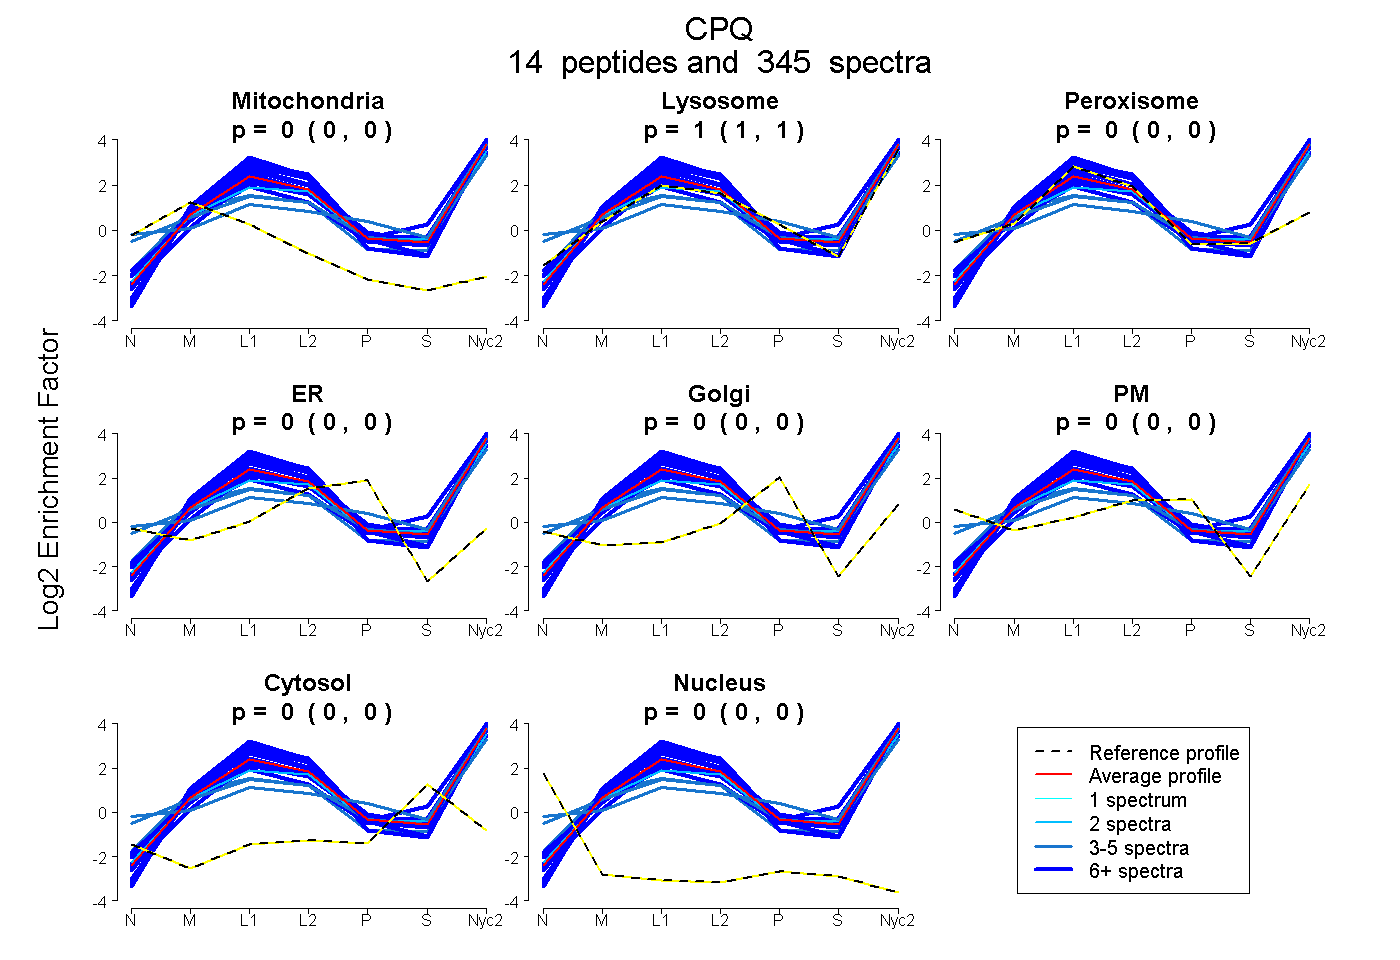
| Plot | Mito | Lyso | Perox | ER | Golgi | PM | Cytosol | Nucleus | |||||
| Expt A |
14 peptides |
345 spectra |
|
0.000 0.000 | 0.000 |
1.000 1.000 | 1.000 |
0.000 0.000 | 0.000 |
0.000 0.000 | 0.000 |
0.000 0.000 | 0.000 |
0.000 0.000 | 0.000 |
0.000 0.000 | 0.000 |
0.000 0.000 | 0.000 |
| 89 spectra, VGAVASLIR | 0.000 | 1.000 | 0.000 | 0.000 | 0.000 | 0.000 | 0.000 | 0.000 | ||
| 16 spectra, GAVEAAK | 0.000 | 0.936 | 0.000 | 0.000 | 0.000 | 0.000 | 0.064 | 0.000 | ||
| 6 spectra, IPTACITIEDAEMMSR | 0.000 | 1.000 | 0.000 | 0.000 | 0.000 | 0.000 | 0.000 | 0.000 | ||
| 3 spectra, AIQIMYQNLQQDGLENVHLEQVR | 0.047 | 0.934 | 0.000 | 0.000 | 0.000 | 0.000 | 0.019 | 0.000 | ||
| 26 spectra, DLGLRPK | 0.000 | 1.000 | 0.000 | 0.000 | 0.000 | 0.000 | 0.000 | 0.000 | ||
| 2 spectra, IVVYNQPYTDYGK | 0.000 | 0.953 | 0.000 | 0.000 | 0.000 | 0.000 | 0.047 | 0.000 | ||
| 40 spectra, LGLLVDTVGPR | 0.000 | 1.000 | 0.000 | 0.000 | 0.000 | 0.000 | 0.000 | 0.000 | ||
| 24 spectra, IPHWER | 0.000 | 1.000 | 0.000 | 0.000 | 0.000 | 0.000 | 0.000 | 0.000 | ||
| 3 spectra, TYPDTDSFNTVAEITGSK | 0.000 | 0.819 | 0.082 | 0.000 | 0.000 | 0.025 | 0.042 | 0.033 | ||
| 9 spectra, AIINLAVYGK | 0.000 | 0.935 | 0.053 | 0.000 | 0.000 | 0.000 | 0.012 | 0.000 | ||
| 23 spectra, IVIHLK | 0.000 | 0.959 | 0.000 | 0.000 | 0.000 | 0.000 | 0.041 | 0.000 | ||
| 46 spectra, GEESAVMVVPR | 0.000 | 0.978 | 0.022 | 0.000 | 0.000 | 0.000 | 0.000 | 0.000 | ||
| 55 spectra, IPHPSMR | 0.000 | 1.000 | 0.000 | 0.000 | 0.000 | 0.000 | 0.000 | 0.000 | ||
| 3 spectra, YFFFHHSHGDTMTAMDPK | 0.000 | 0.739 | 0.000 | 0.000 | 0.000 | 0.181 | 0.080 | 0.000 |
| Plot | Mito | Lyso or Perox | ER | Golgi | PM | Cytosol | Nucleus | ||||||
| Expt B |
15 peptides |
136 spectra |
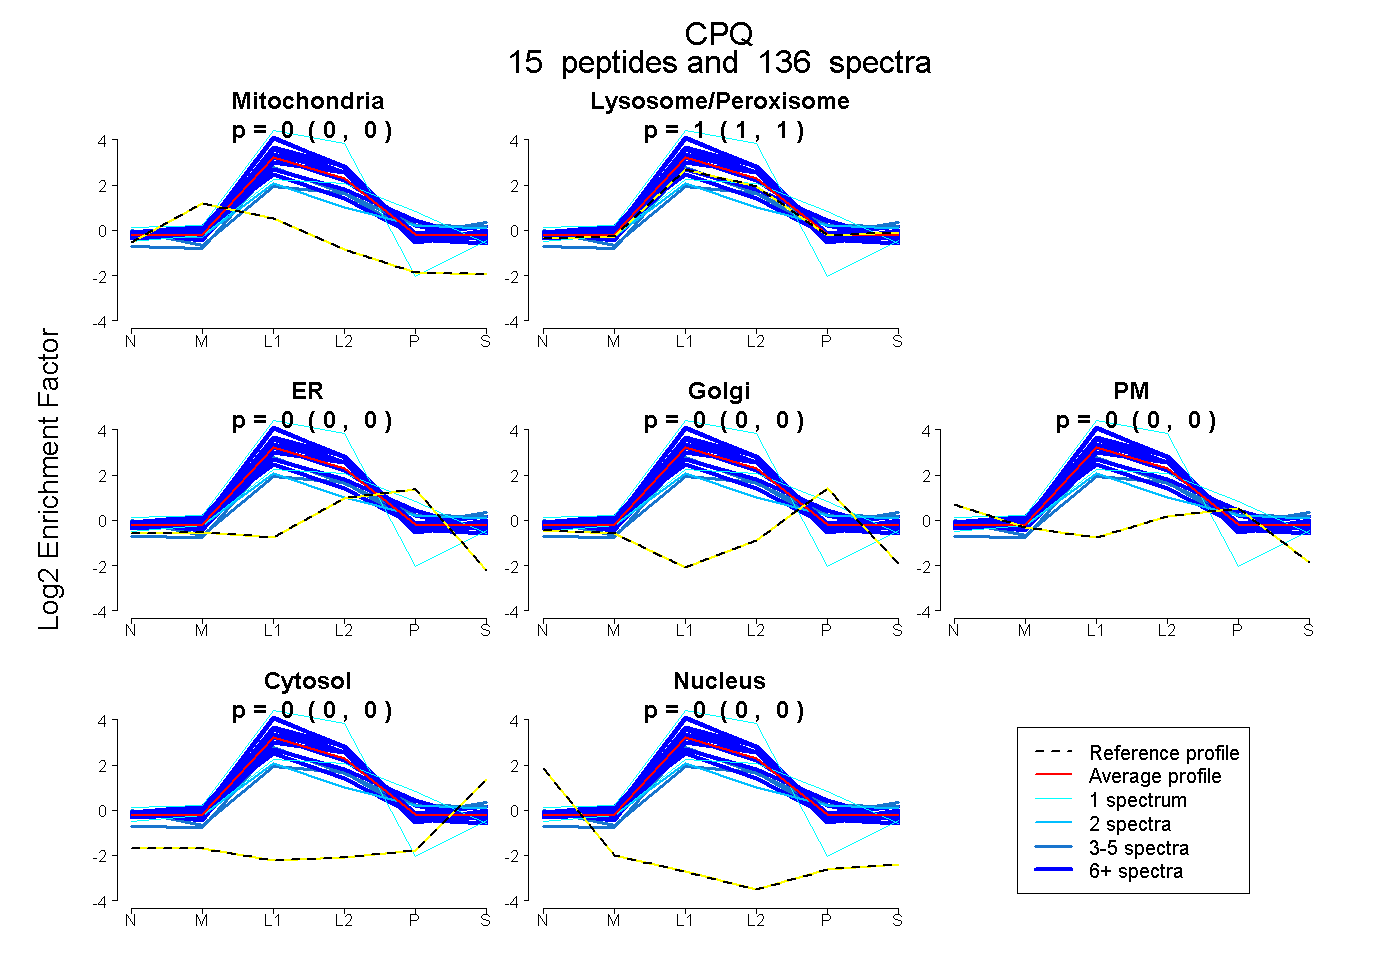 |
0.000 0.000 | 0.000 |
1.000 1.000 | 1.000 |
0.000 0.000 | 0.000 |
0.000 0.000 | 0.000 |
0.000 0.000 | 0.000 |
0.000 0.000 | 0.000 |
0.000 0.000 | 0.000 |
|||
| Plot | Lyso | Other | |||||||||||
| Expt C |
16 peptides |
914 spectra |
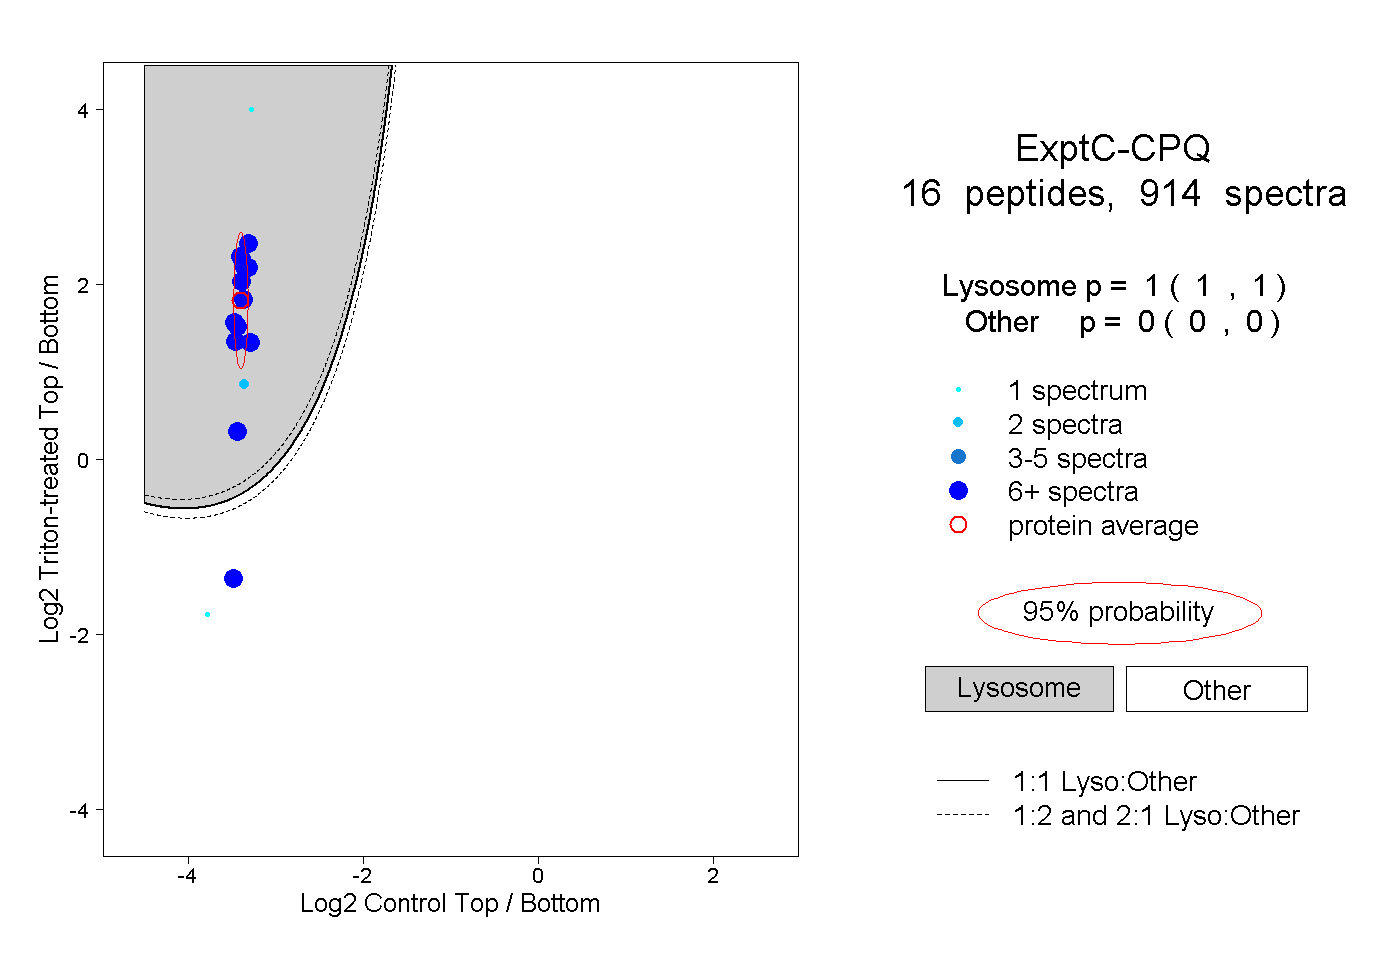 |
1.000 1.000 | 1.000 |
0.000 0.000 | 0.000 |
||||||||
| Plot | Lyso | Other | |||||||||||
| Expt D |
9 peptides |
78 spectra |
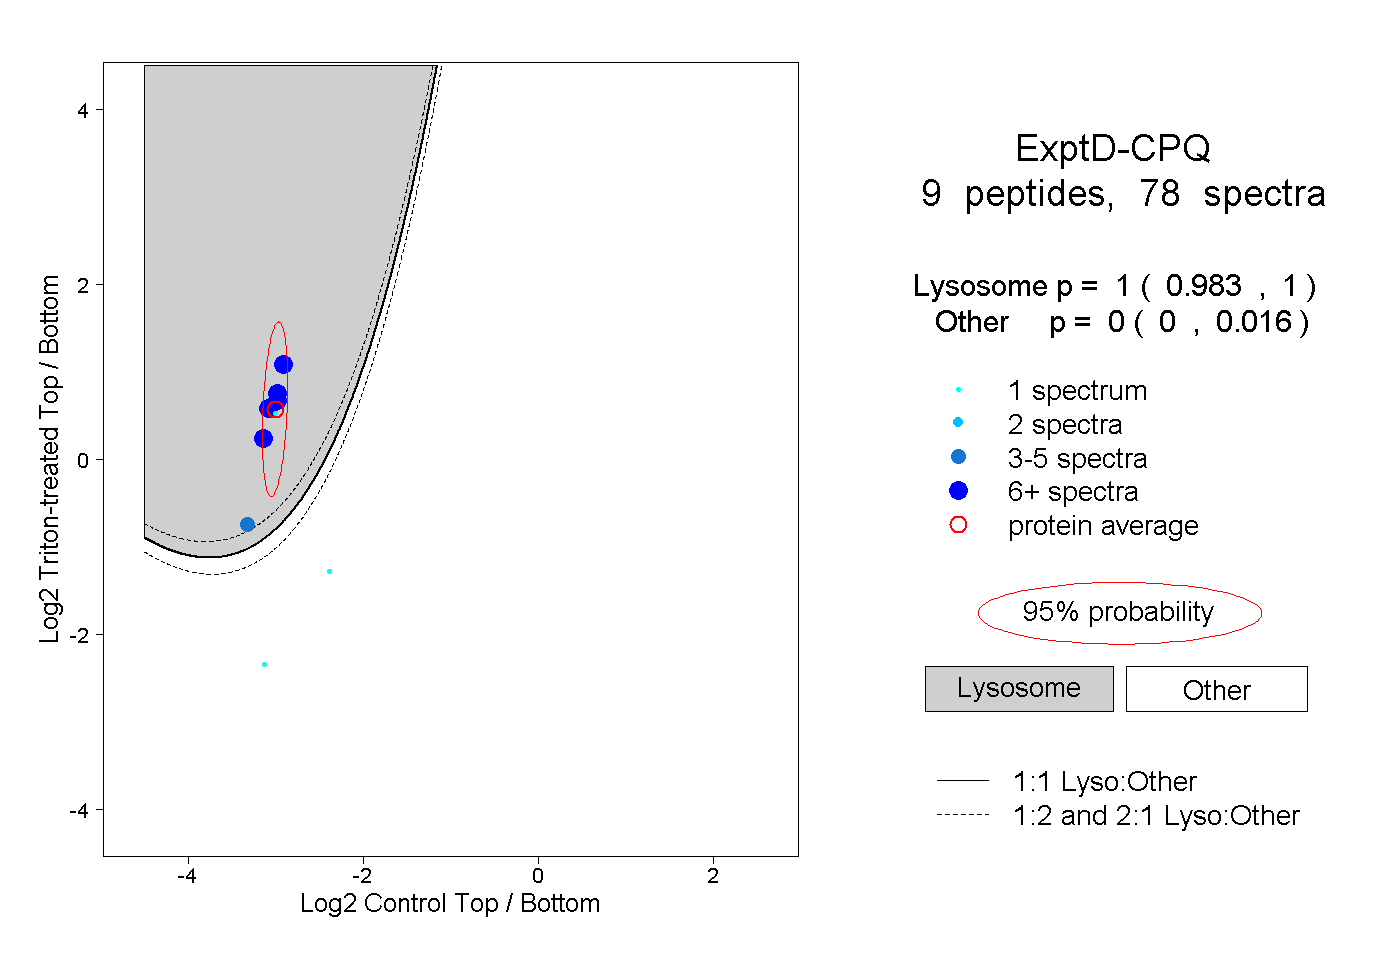 |
1.000 0.983 | 1.000 |
0.000 0.000 | 0.016 |