 2
2peptides
spectra
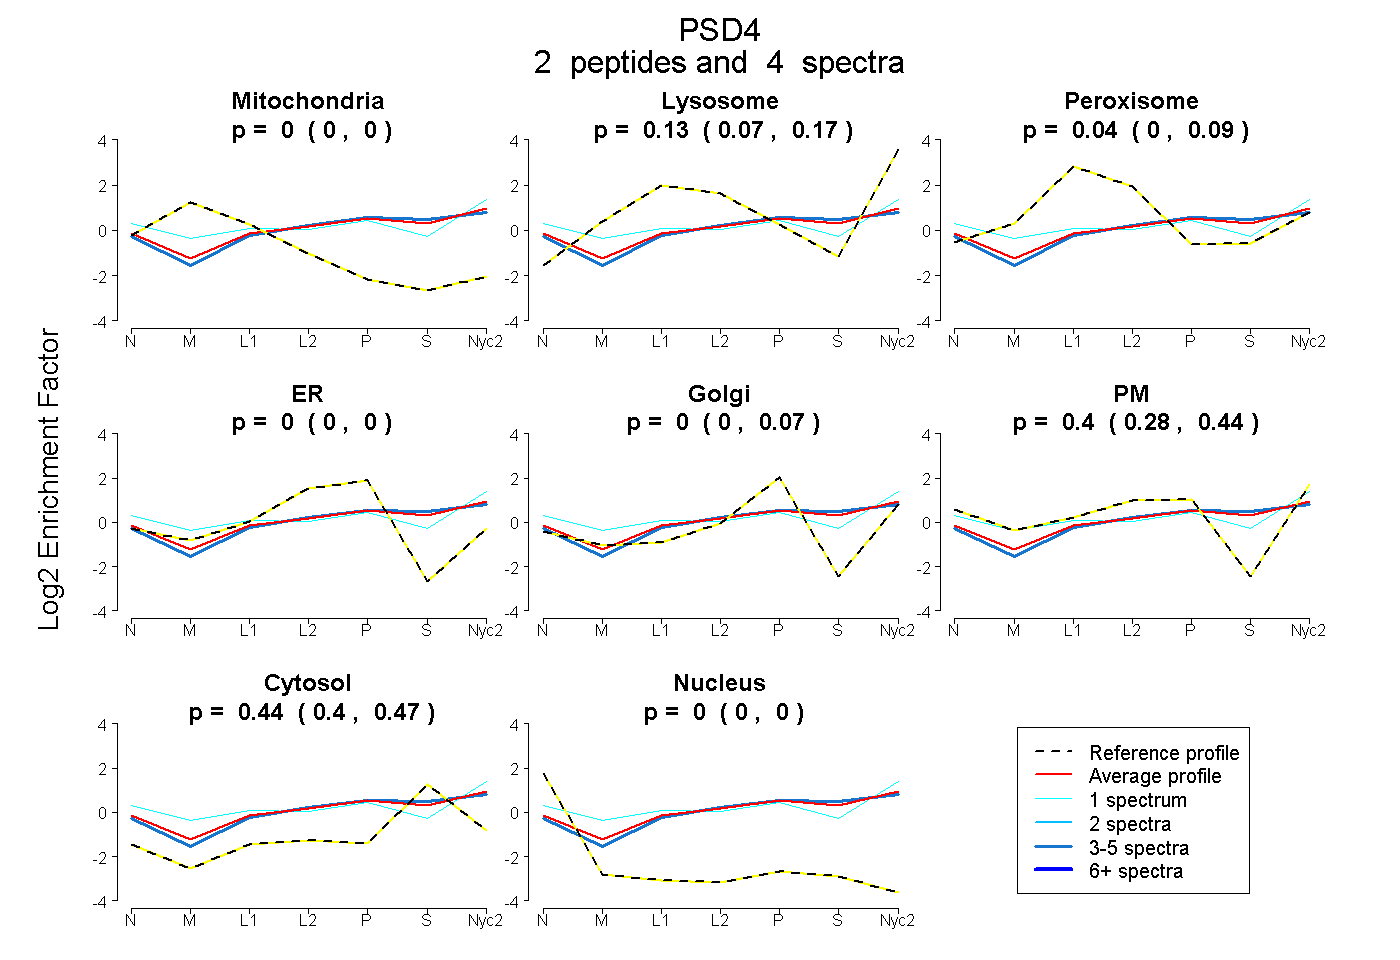
0.000 | 0.000
0.069 | 0.171
0.000 | 0.087
0.000 | 0.000
0.000 | 0.070
0.283 | 0.437
0.396 | 0.467
0.000 | 0.000
| Plot | Mito | Lyso | Perox | ER | Golgi | PM | Cytosol | Nucleus | |||||
| Expt A |
2 peptides |
4 spectra |
|
0.000 0.000 | 0.000 |
0.127 0.069 | 0.171 |
0.038 0.000 | 0.087 |
0.000 0.000 | 0.000 |
0.000 0.000 | 0.070 |
0.395 0.283 | 0.437 |
0.440 0.396 | 0.467 |
0.000 0.000 | 0.000 |
| 1 spectrum, LHFPLK | 0.000 | 0.130 | 0.057 | 0.000 | 0.000 | 0.514 | 0.299 | 0.000 | ||
| 3 spectra, MFHTLLR | 0.000 | 0.126 | 0.052 | 0.000 | 0.057 | 0.293 | 0.473 | 0.000 |
| Plot | Lyso | Other | |||||||||||
| Expt C |
1 peptide |
2 spectra |
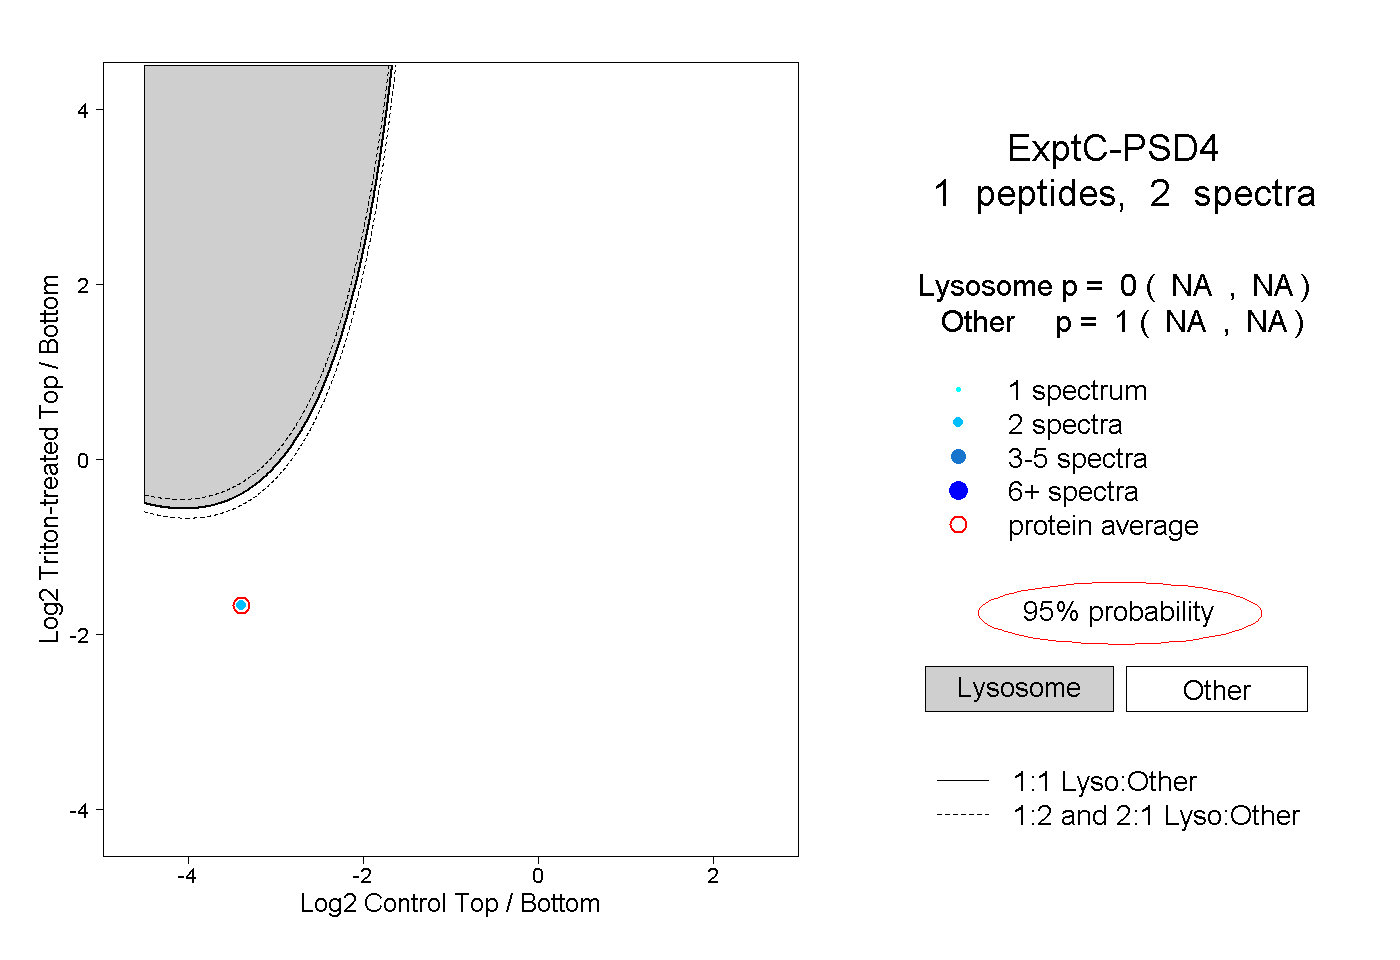 |
0.000 NA | NA |
1.000 NA | NA |