 8
8peptides
spectra
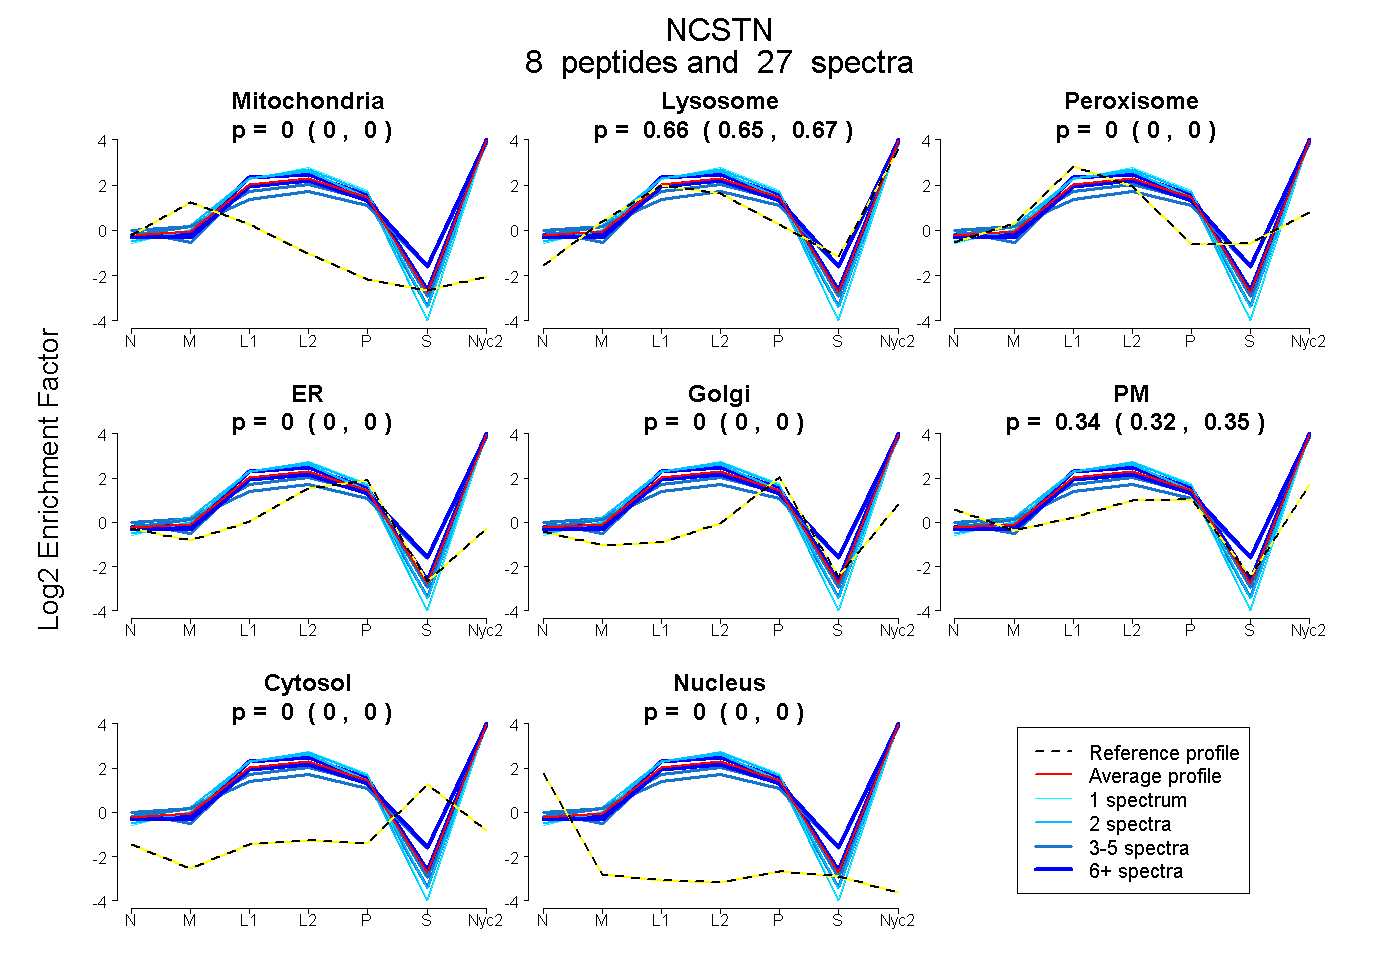
0.000 | 0.000
0.650 | 0.674
0.000 | 0.000
0.000 | 0.000
0.000 | 0.000
0.324 | 0.348
0.000 | 0.000
0.000 | 0.000
4peptides
spectra
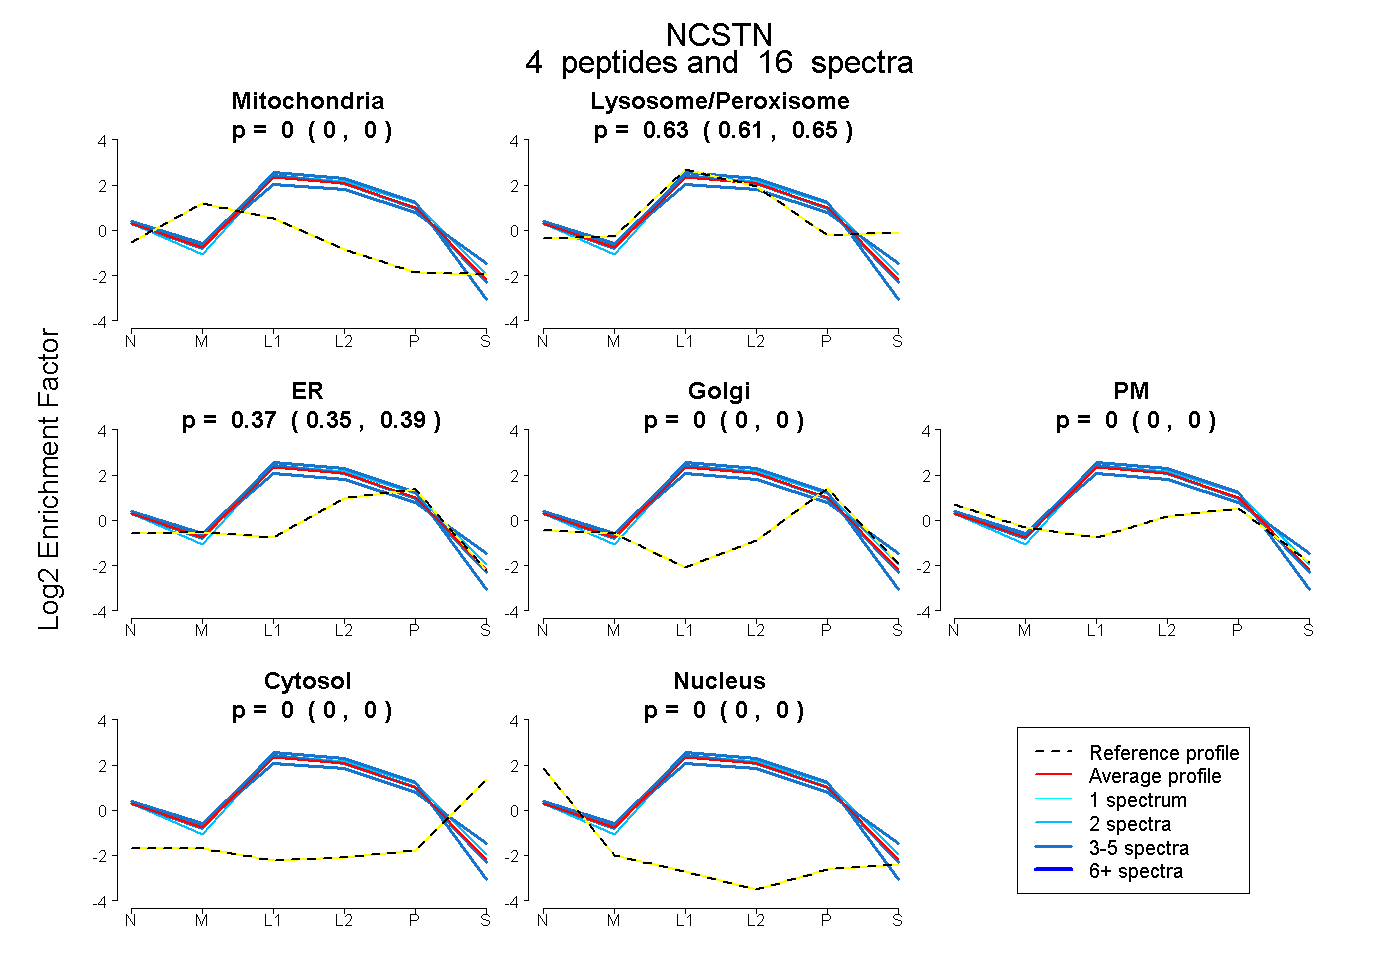
0.000 | 0.000
0.607 | 0.647
0.350 | 0.390
0.000 | 0.000
0.000 | 0.000
0.000 | 0.000
0.000 | 0.000
9peptides
spectra
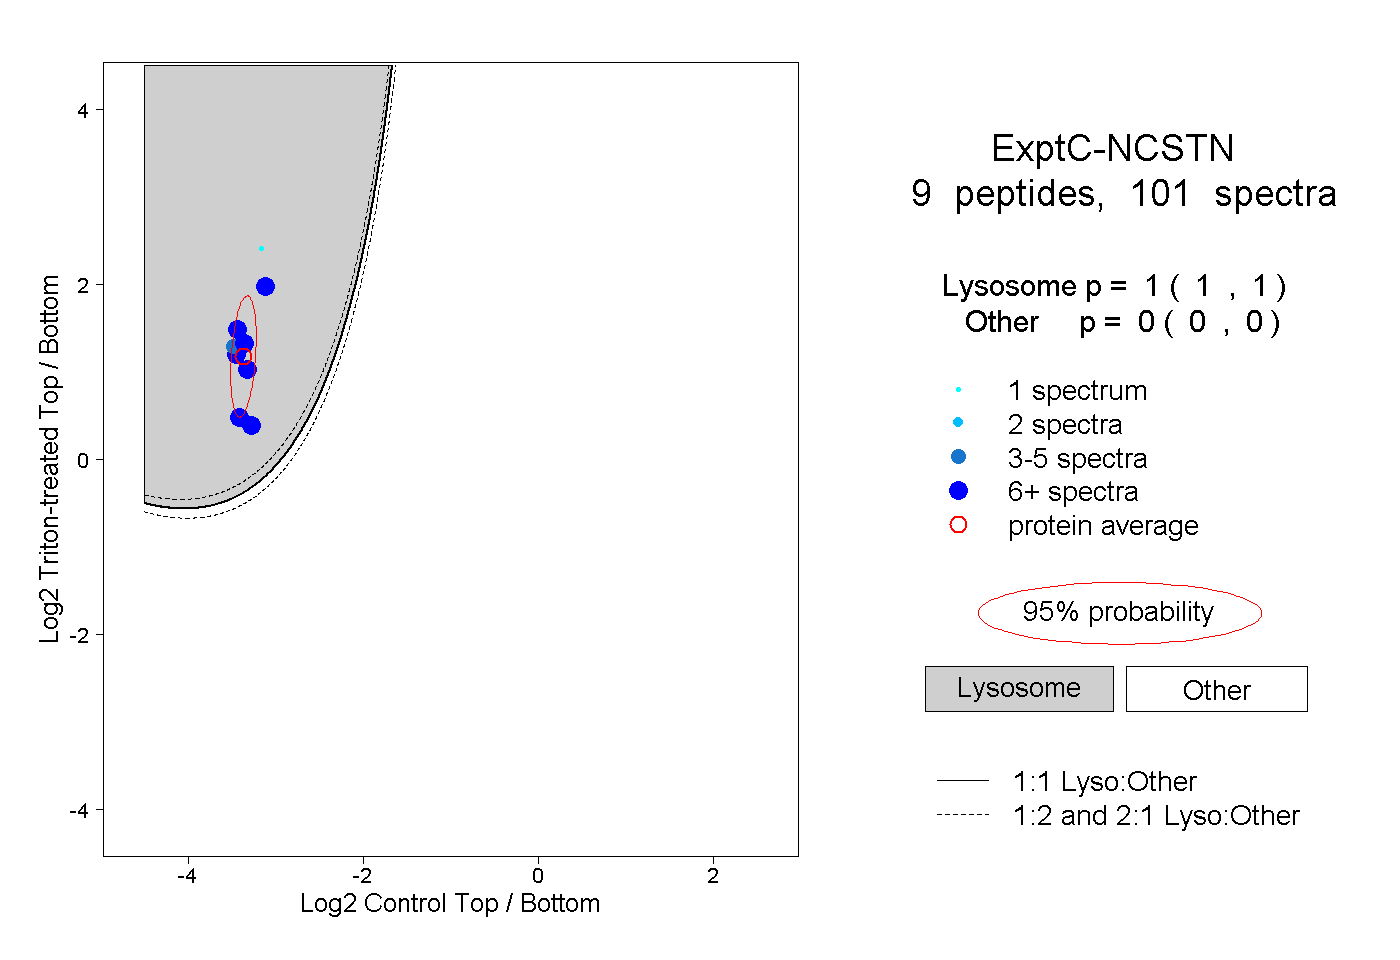
1.000 | 1.000
0.000 | 0.000
4peptides
spectra
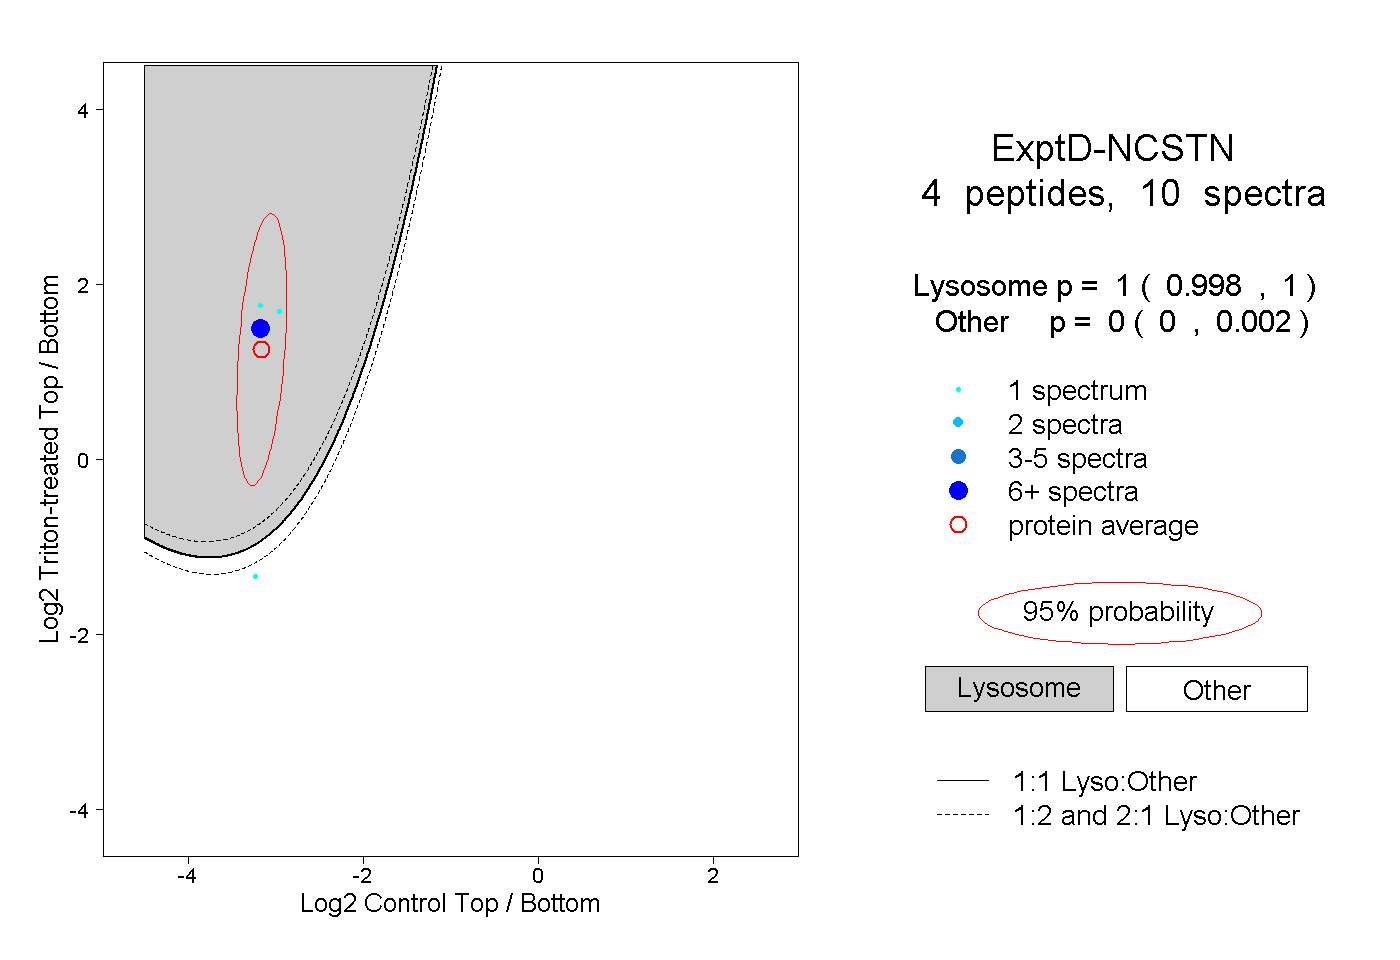
0.998 | 1.000
0.000 | 0.002