12
12peptides
spectra
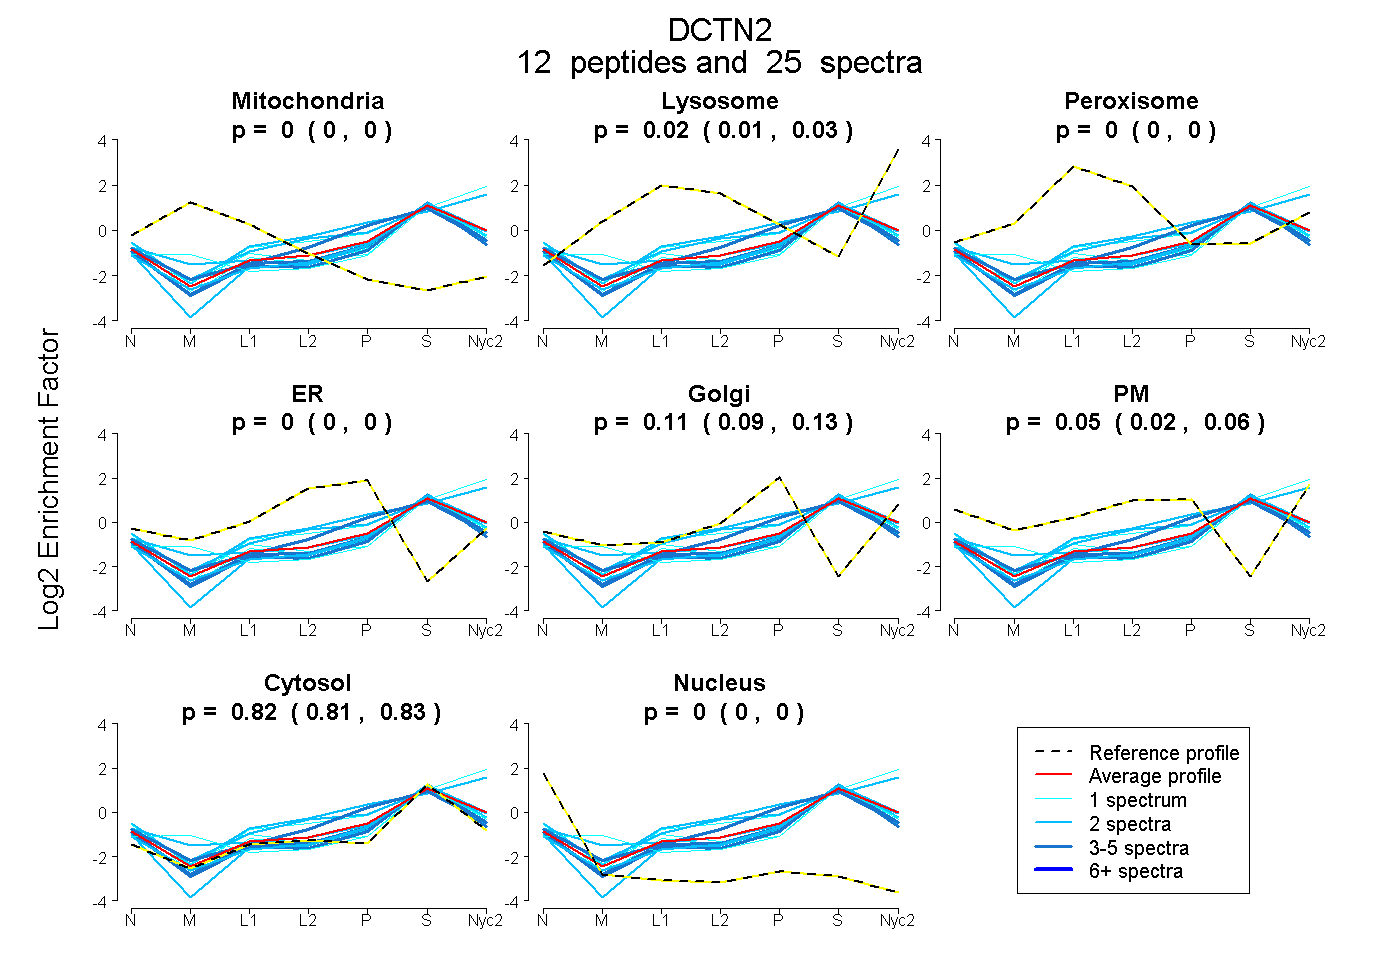
0.000 | 0.000
0.006 | 0.032
0.000 | 0.000
0.000 | 0.000
0.090 | 0.132
0.022 | 0.064
0.813 | 0.830
0.000 | 0.000
7peptides
spectra
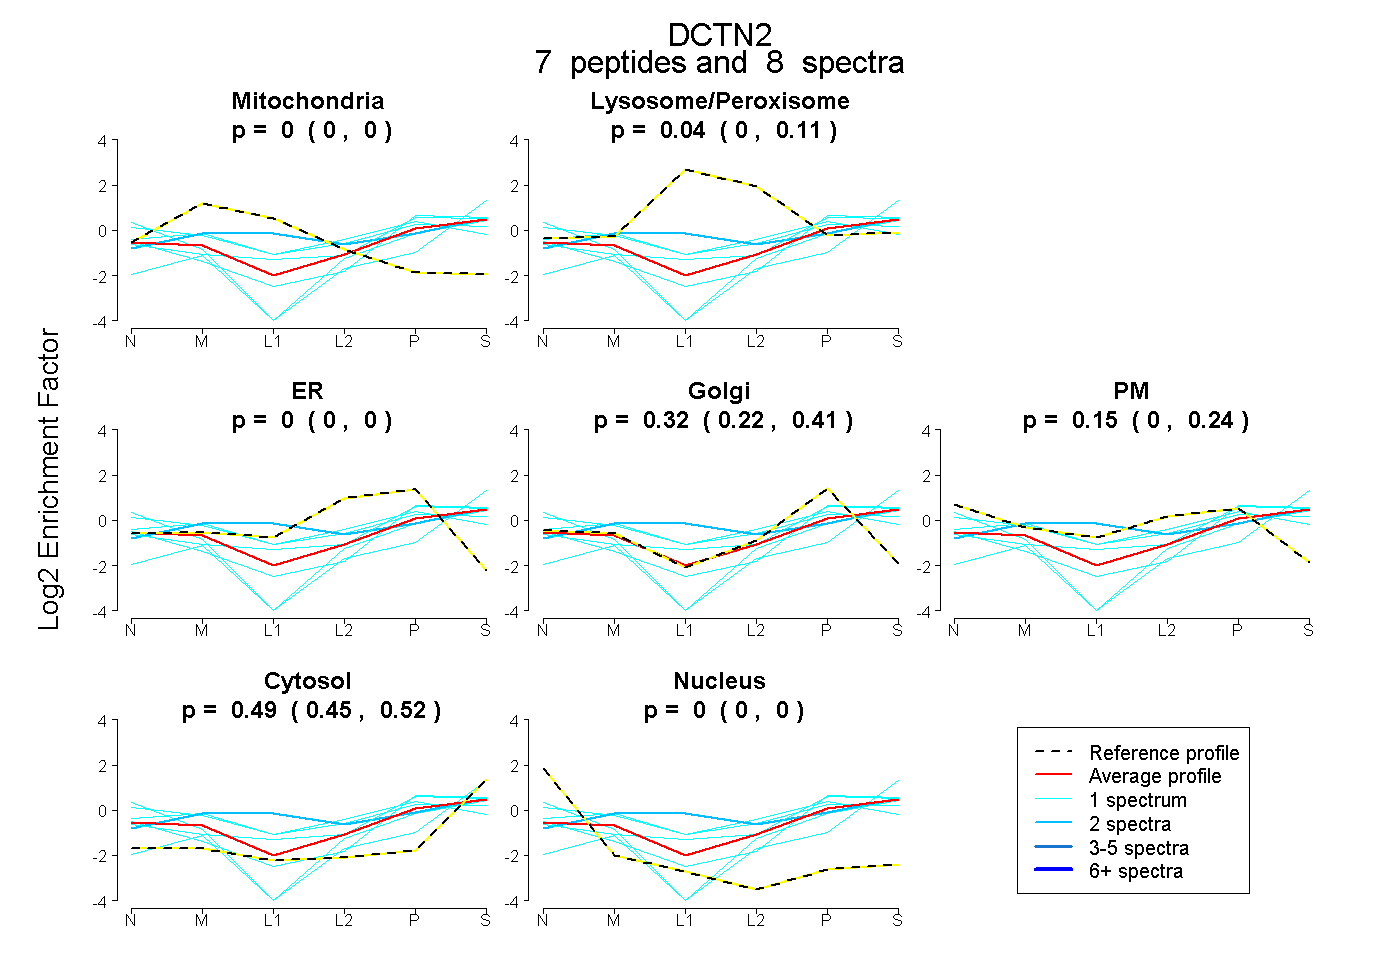
0.000 | 0.000
0.000 | 0.110
0.000 | 0.000
0.225 | 0.415
0.003 | 0.244
0.452 | 0.516
0.000 | 0.000
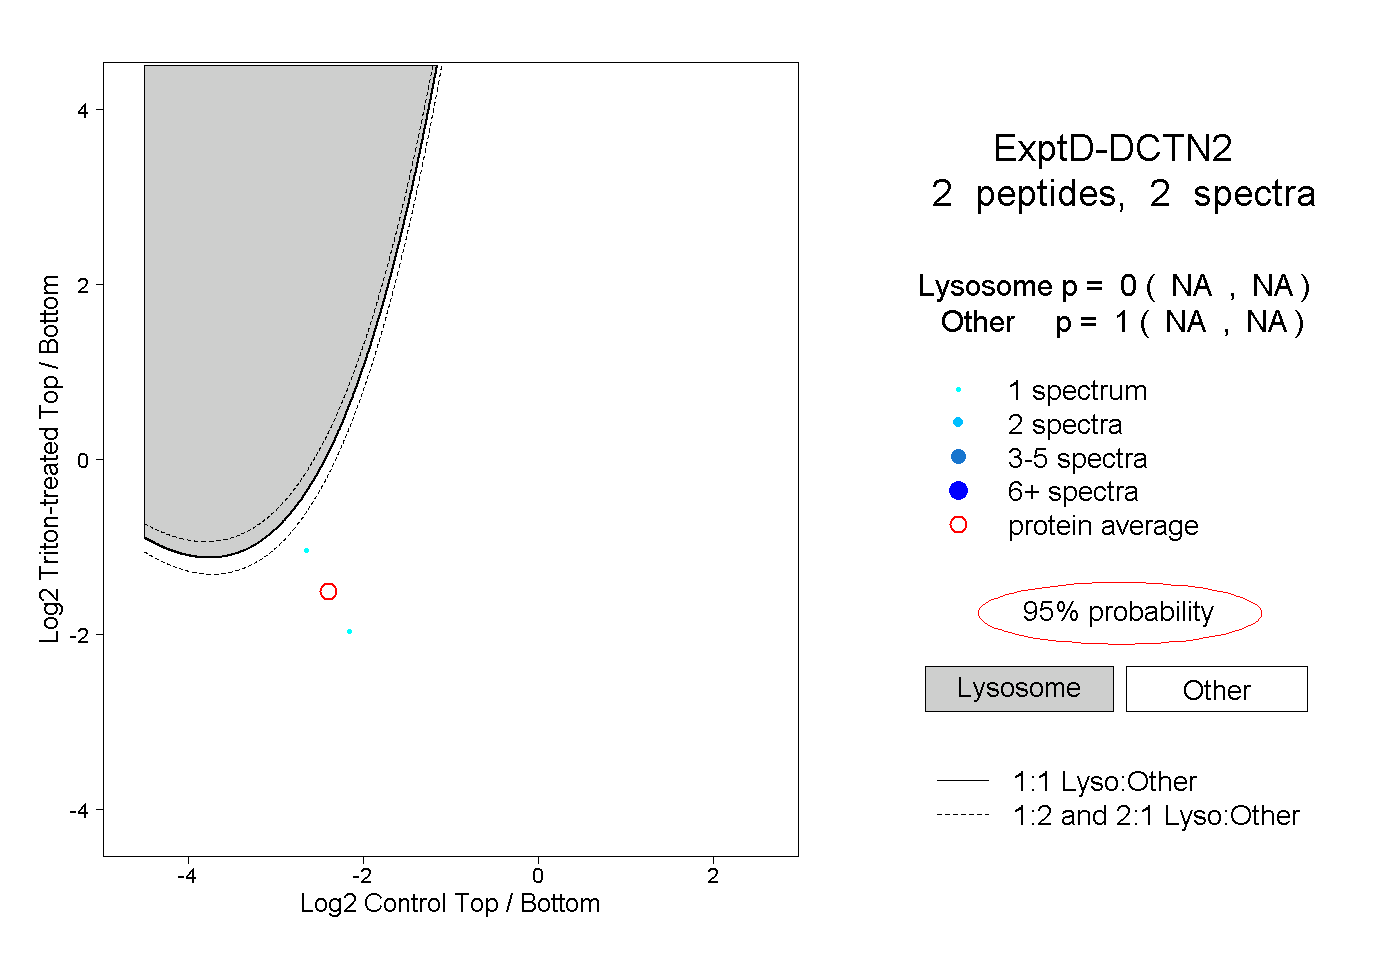
13peptides
spectra
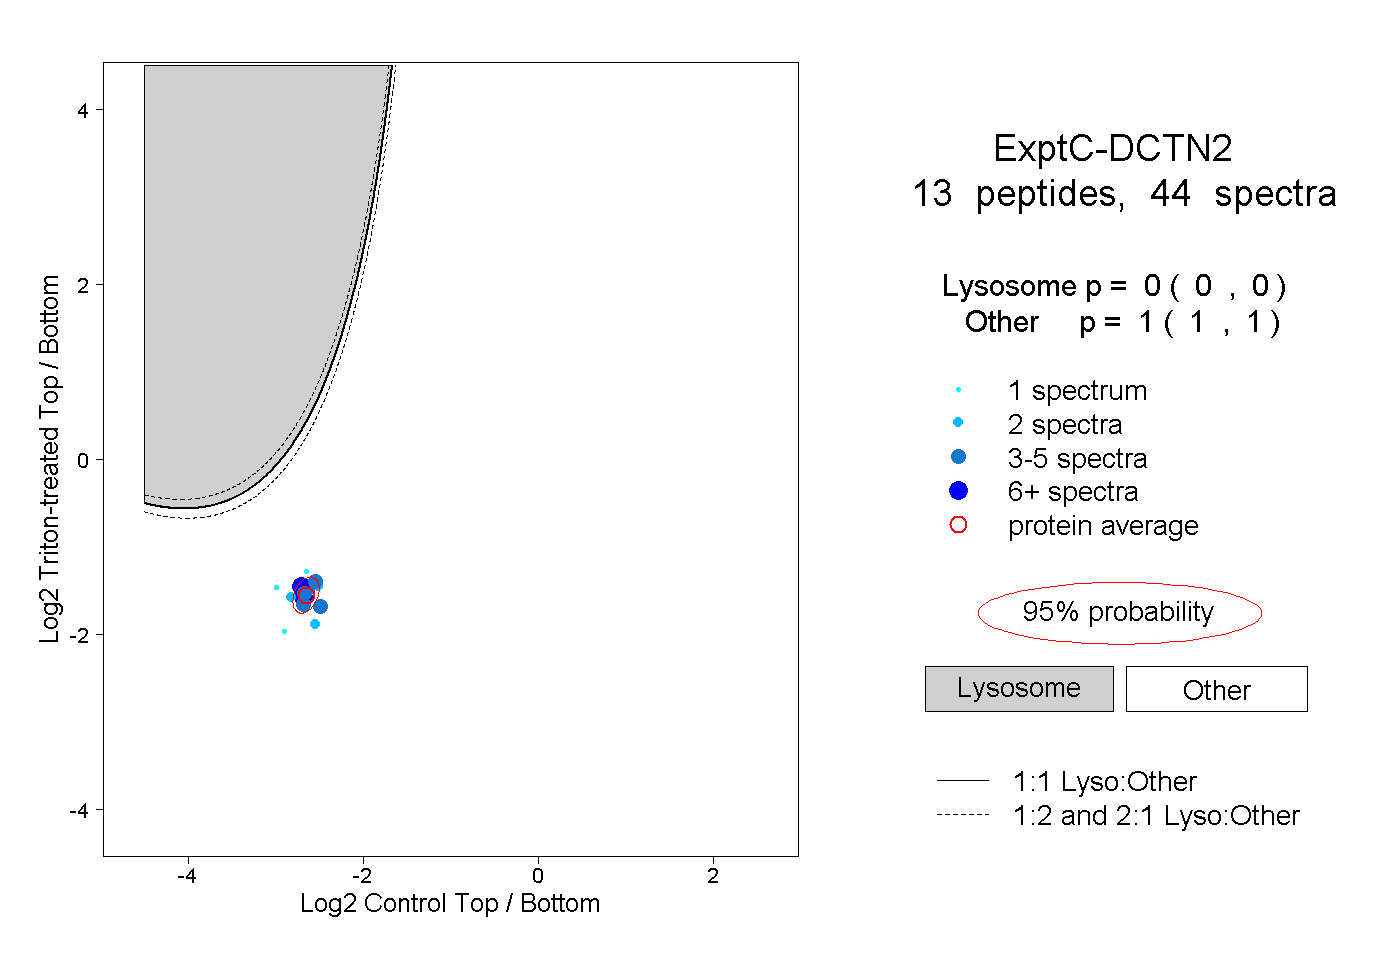
0.000 | 0.000
1.000 | 1.000