 12
12peptides
spectra
0.000 | 0.000
0.006 | 0.032
0.000 | 0.000
0.000 | 0.000
0.090 | 0.132
0.022 | 0.064
0.813 | 0.830
0.000 | 0.000
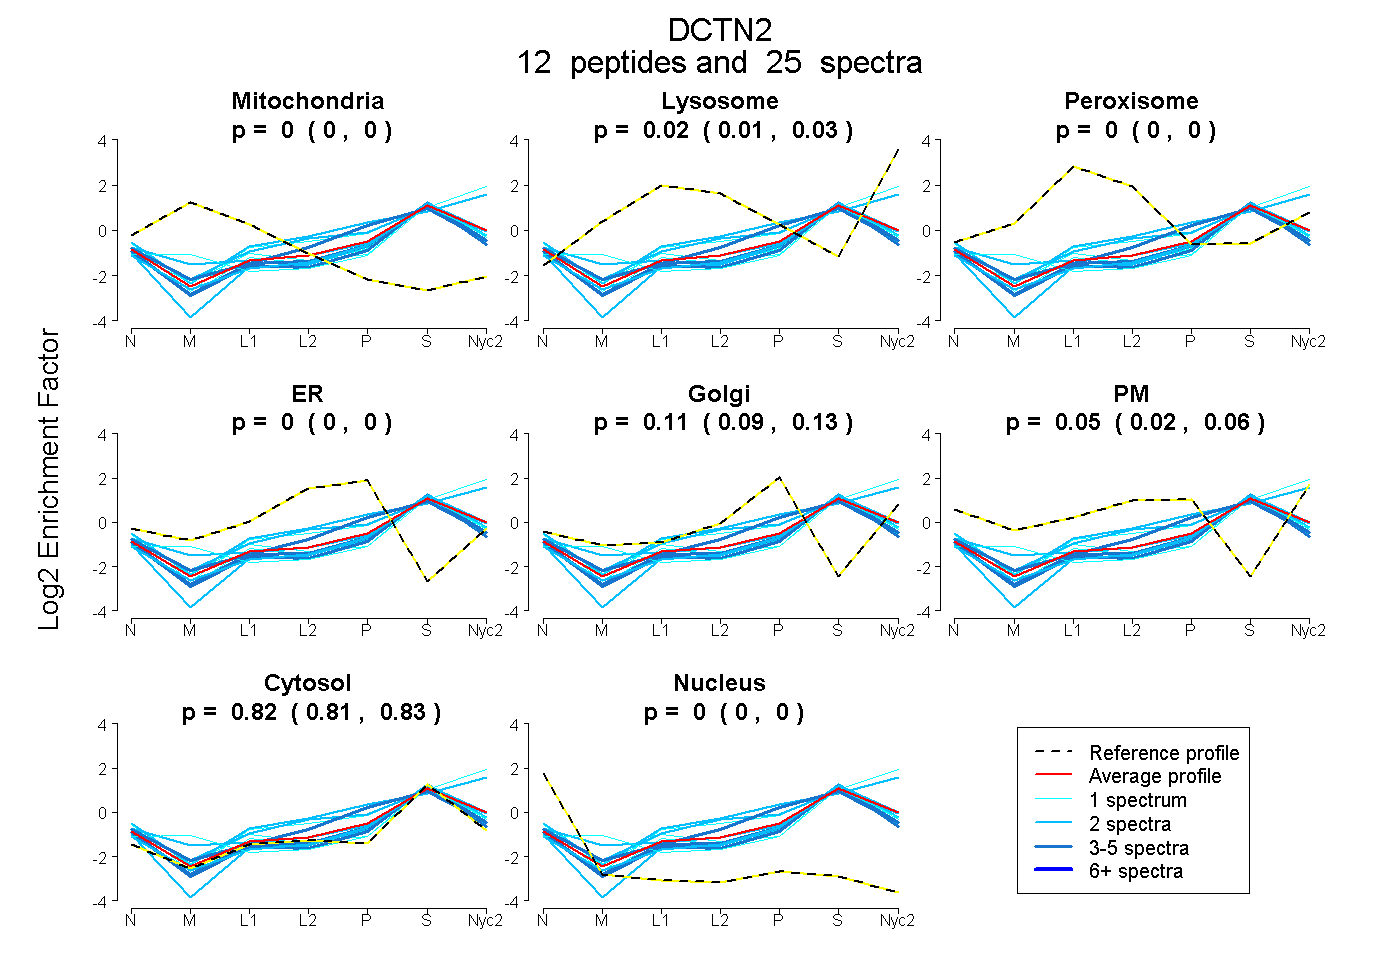
| Plot | Mito | Lyso | Perox | ER | Golgi | PM | Cytosol | Nucleus | |||||
| Expt A |
12 peptides |
25 spectra |
|
0.000 0.000 | 0.000 |
0.020 0.006 | 0.032 |
0.000 0.000 | 0.000 |
0.000 0.000 | 0.000 |
0.112 0.090 | 0.132 |
0.046 0.022 | 0.064 |
0.822 0.813 | 0.830 |
0.000 0.000 | 0.000 |
| 3 spectra, VHQLYETIQR | 0.000 | 0.000 | 0.000 | 0.002 | 0.271 | 0.000 | 0.727 | 0.000 | ||
| 1 spectrum, ENLATVEGNFASIDAR | 0.000 | 0.014 | 0.022 | 0.000 | 0.000 | 0.061 | 0.902 | 0.000 | ||
| 1 spectrum, LLLQLEATK | 0.000 | 0.258 | 0.000 | 0.000 | 0.000 | 0.100 | 0.643 | 0.000 | ||
| 4 spectra, GLDFSDR | 0.000 | 0.000 | 0.000 | 0.000 | 0.047 | 0.000 | 0.922 | 0.031 | ||
| 2 spectra, LQSVLGK | 0.000 | 0.021 | 0.000 | 0.000 | 0.027 | 0.168 | 0.785 | 0.000 | ||
| 4 spectra, ETPQQK | 0.000 | 0.000 | 0.000 | 0.000 | 0.102 | 0.000 | 0.898 | 0.000 | ||
| 2 spectra, LTELEATVR | 0.000 | 0.000 | 0.000 | 0.000 | 0.119 | 0.000 | 0.881 | 0.000 | ||
| 1 spectrum, ASVEDADTQNK | 0.000 | 0.000 | 0.000 | 0.000 | 0.080 | 0.009 | 0.911 | 0.000 | ||
| 2 spectra, ESATEEK | 0.000 | 0.000 | 0.000 | 0.000 | 0.044 | 0.000 | 0.956 | 0.000 | ||
| 1 spectrum, QLAALK | 0.094 | 0.027 | 0.000 | 0.000 | 0.058 | 0.000 | 0.821 | 0.000 | ||
| 2 spectra, LTPVVLAK | 0.000 | 0.004 | 0.034 | 0.201 | 0.005 | 0.014 | 0.741 | 0.000 | ||
| 2 spectra, DNTALLTQVQTTMR | 0.000 | 0.233 | 0.000 | 0.000 | 0.144 | 0.060 | 0.564 | 0.000 |
| Plot | Mito | Lyso or Perox | ER | Golgi | PM | Cytosol | Nucleus | ||||||
| Expt B |
7 peptides |
8 spectra |
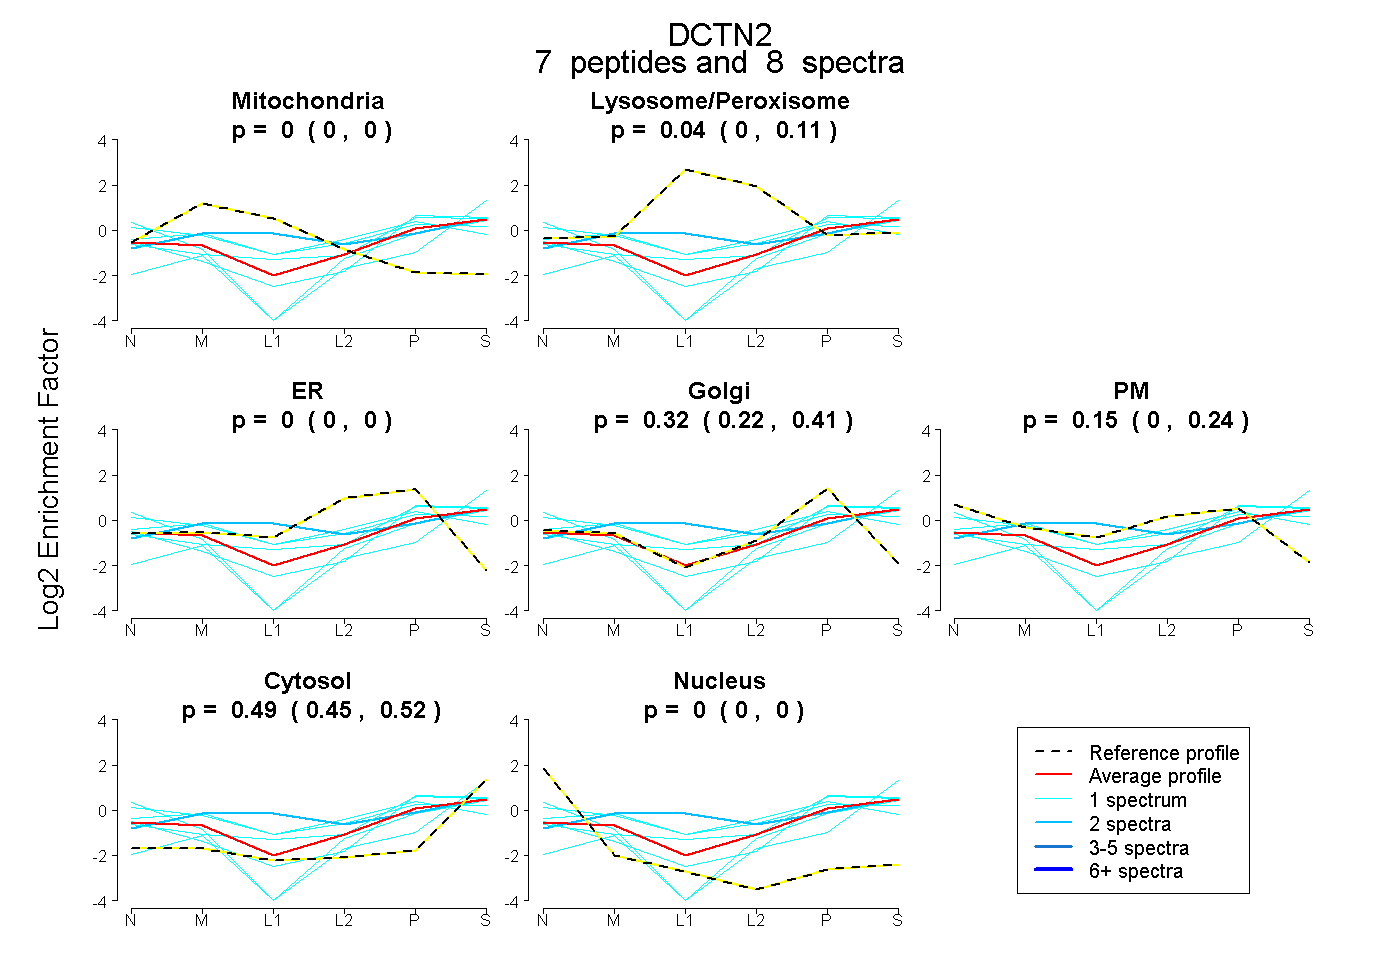 |
0.000 0.000 | 0.000 |
0.042 0.000 | 0.110 |
0.000 0.000 | 0.000 |
0.322 0.225 | 0.415 |
0.148 0.003 | 0.244 |
0.488 0.452 | 0.516 |
0.000 0.000 | 0.000 |
|||
| Plot | Lyso | Other | |||||||||||
| Expt C |
13 peptides |
44 spectra |
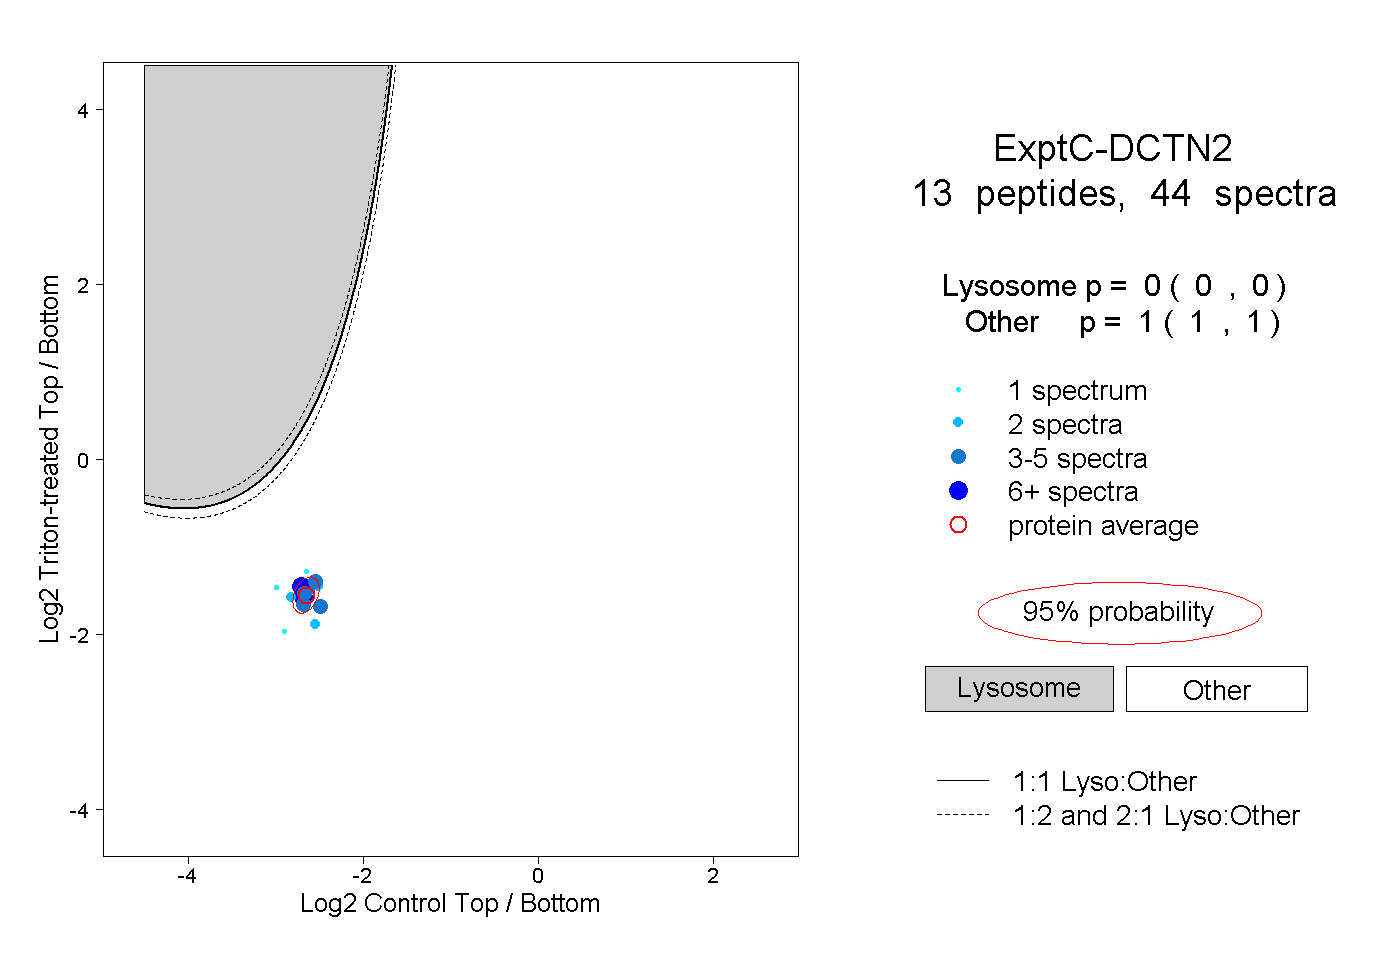 |
0.000 0.000 | 0.000 |
1.000 1.000 | 1.000 |
||||||||
| Plot | Lyso | Other | |||||||||||
| Expt D |
2 peptides |
2 spectra |
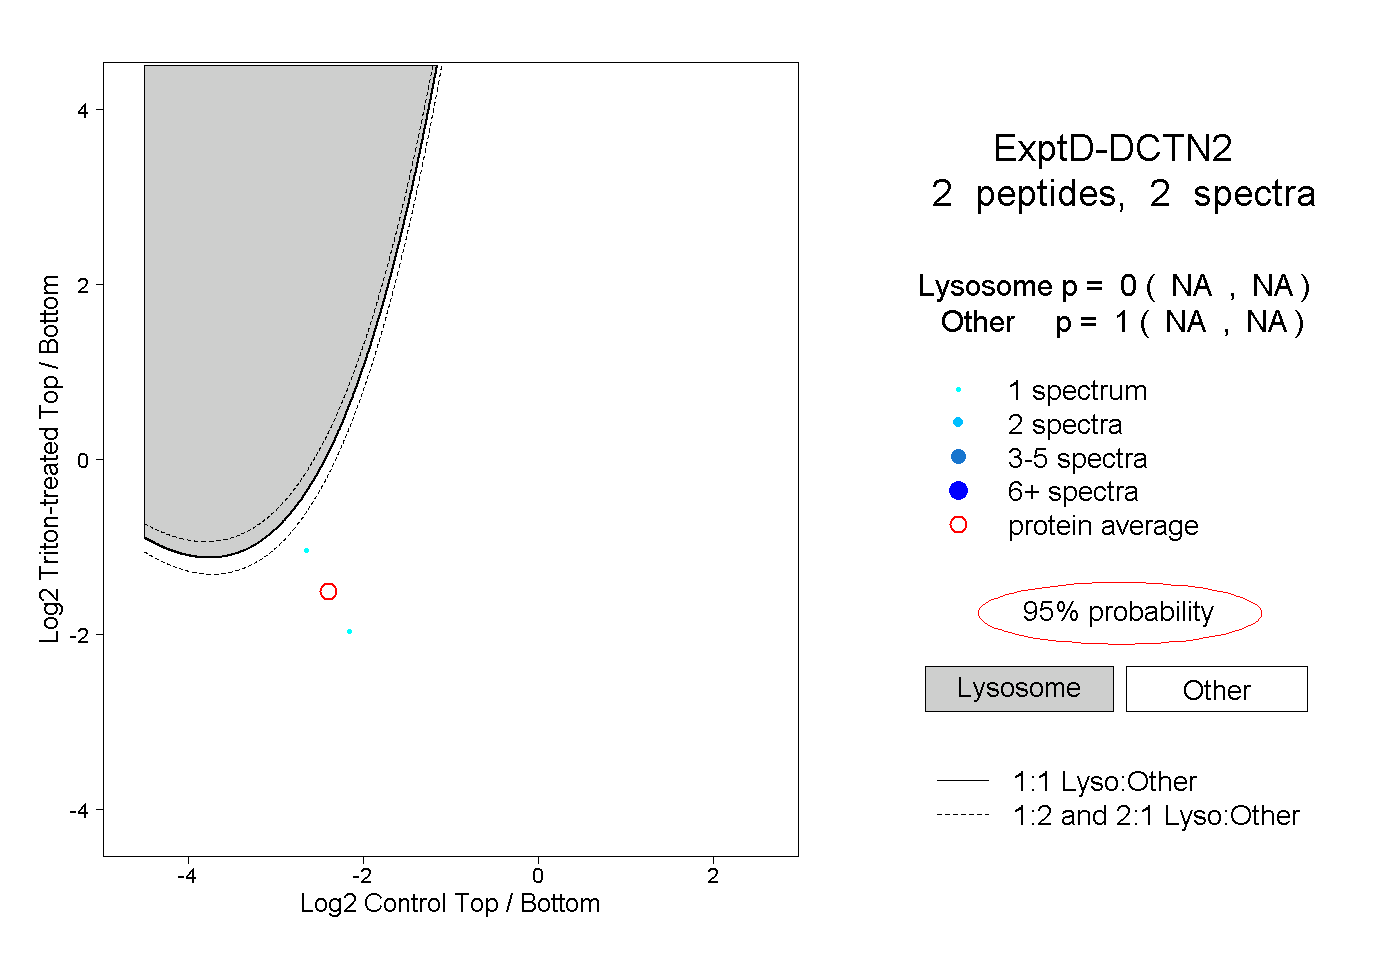 |
0.000 NA | NA |
1.000 NA | NA |