 5
5peptides
spectra
0.000 | 0.037
0.000 | 0.047
0.146 | 0.201
0.000 | 0.000
0.000 | 0.019
0.000 | 0.000
0.764 | 0.791
0.000 | 0.000
| Plot | Mito | Lyso | Perox | ER | Golgi | PM | Cytosol | Nucleus | |||||
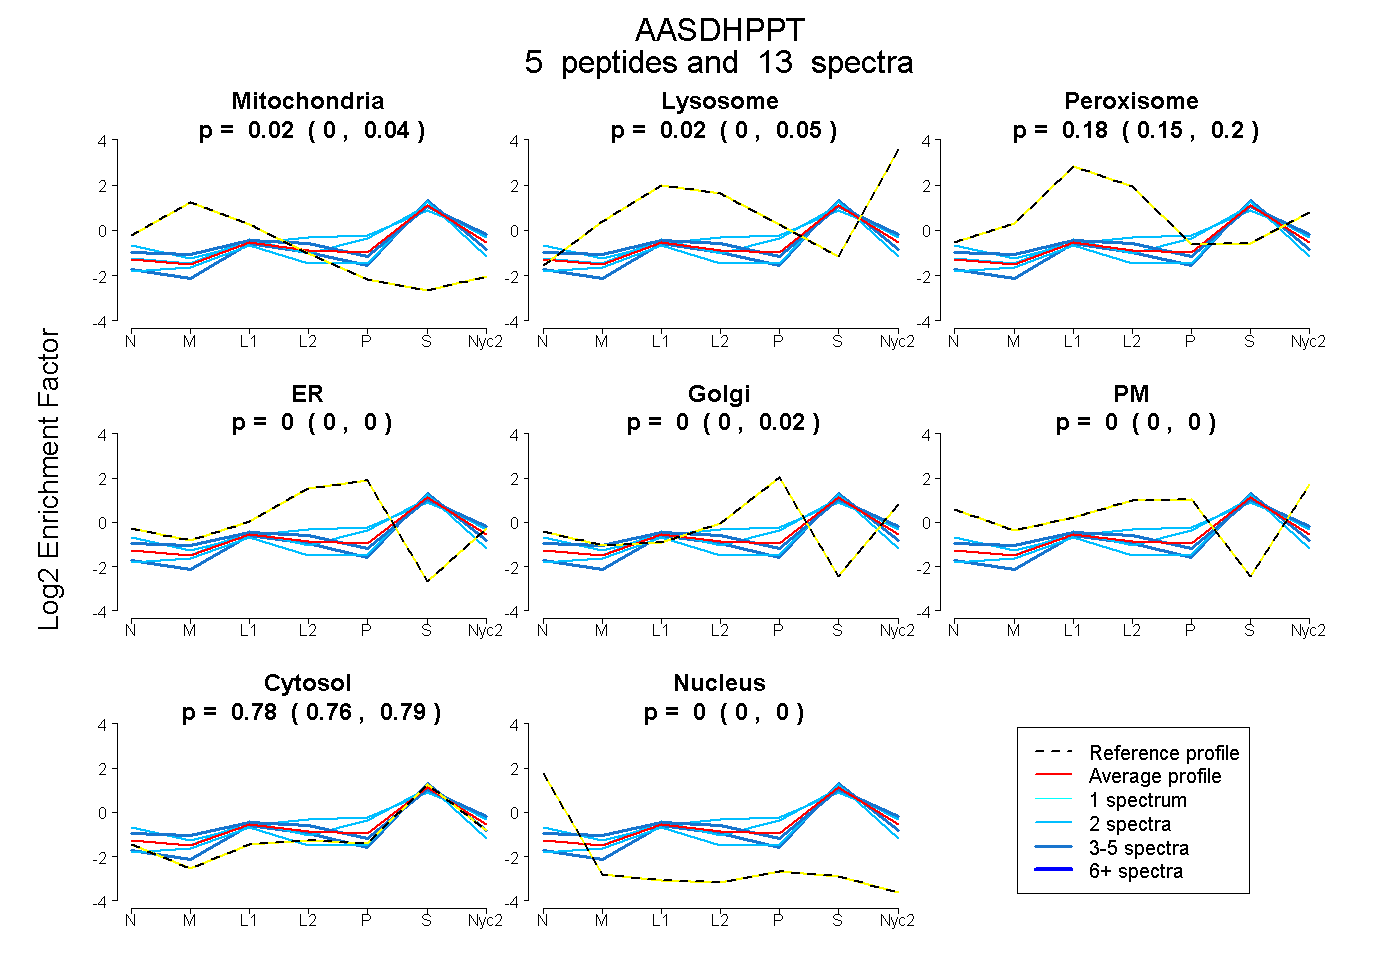
| Expt A |
5 peptides |
13 spectra |
|
0.022 0.000 | 0.037 |
0.022 0.000 | 0.047 |
0.177 0.146 | 0.201 |
0.000 0.000 | 0.000 |
0.000 0.000 | 0.019 |
0.000 0.000 | 0.000 |
0.780 0.764 | 0.791 |
0.000 0.000 | 0.000 |
| 2 spectra, IDQHHFVAVALR | 0.000 | 0.047 | 0.140 | 0.000 | 0.084 | 0.000 | 0.729 | 0.000 | ||
| 2 spectra, HQNVSYQDDSKPSQR | 0.000 | 0.000 | 0.205 | 0.000 | 0.124 | 0.050 | 0.621 | 0.000 | ||
| 2 spectra, GSIPEFFHIMK | 0.102 | 0.000 | 0.039 | 0.000 | 0.000 | 0.000 | 0.859 | 0.000 | ||
| 4 spectra, IGQFVFAR | 0.052 | 0.071 | 0.184 | 0.000 | 0.000 | 0.000 | 0.692 | 0.000 | ||
| 3 spectra, EWETIR | 0.000 | 0.000 | 0.122 | 0.000 | 0.000 | 0.000 | 0.878 | 0.000 |
| Plot | Mito | Lyso or Perox | ER | Golgi | PM | Cytosol | Nucleus | ||||||
| Expt B |
2 peptides |
3 spectra |
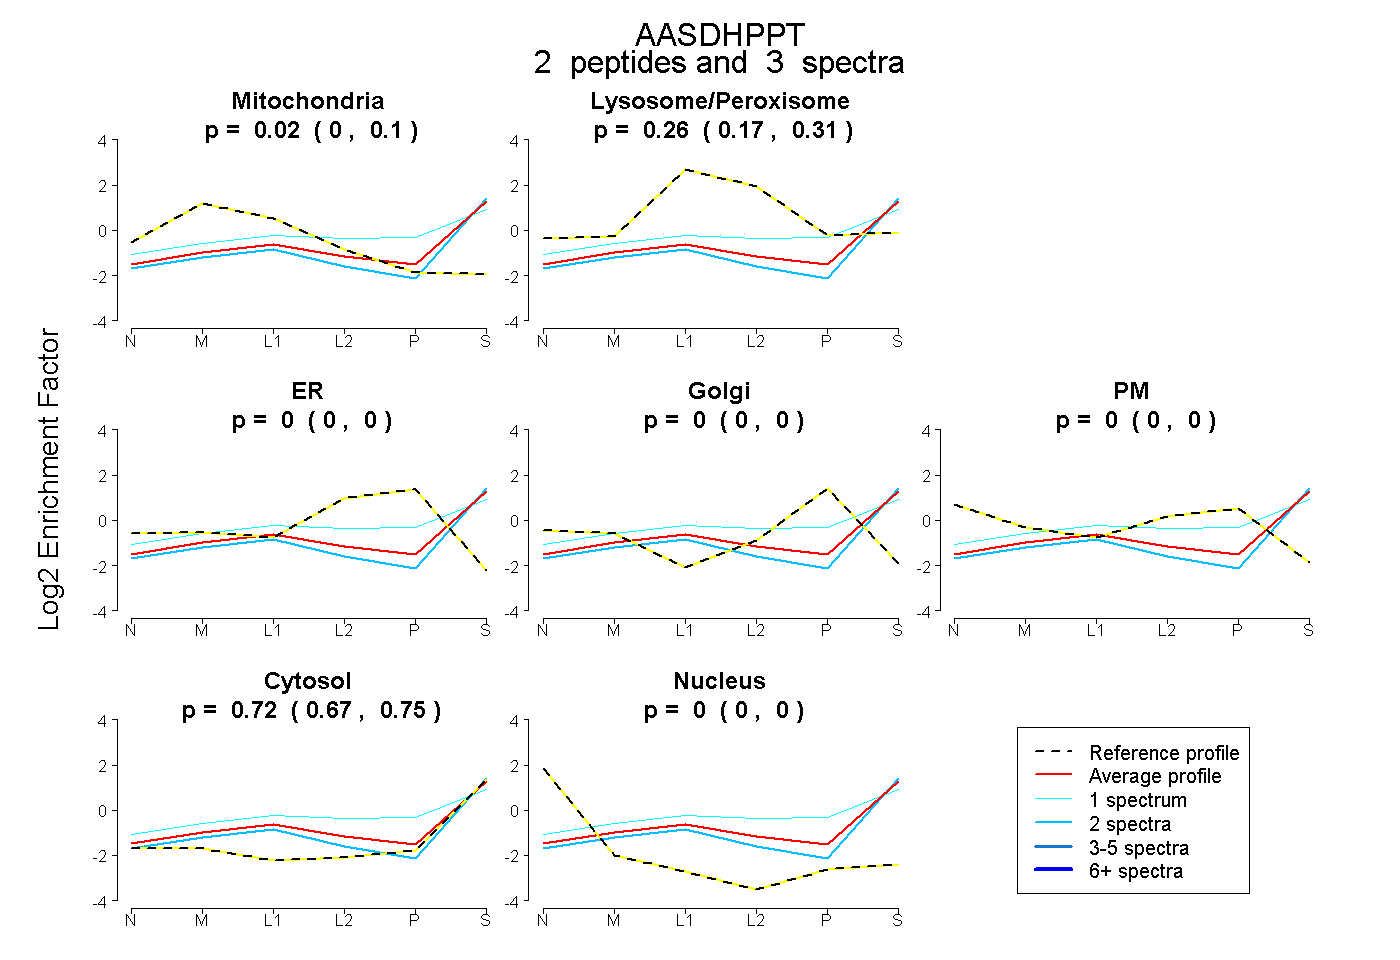 |
0.017 0.000 | 0.096 |
0.261 0.169 | 0.312 |
0.000 0.000 | 0.000 |
0.000 0.000 | 0.004 |
0.000 0.000 | 0.000 |
0.721 0.667 | 0.754 |
0.000 0.000 | 0.000 |
|||
| Plot | Lyso | Other | |||||||||||
| Expt C |
6 peptides |
14 spectra |
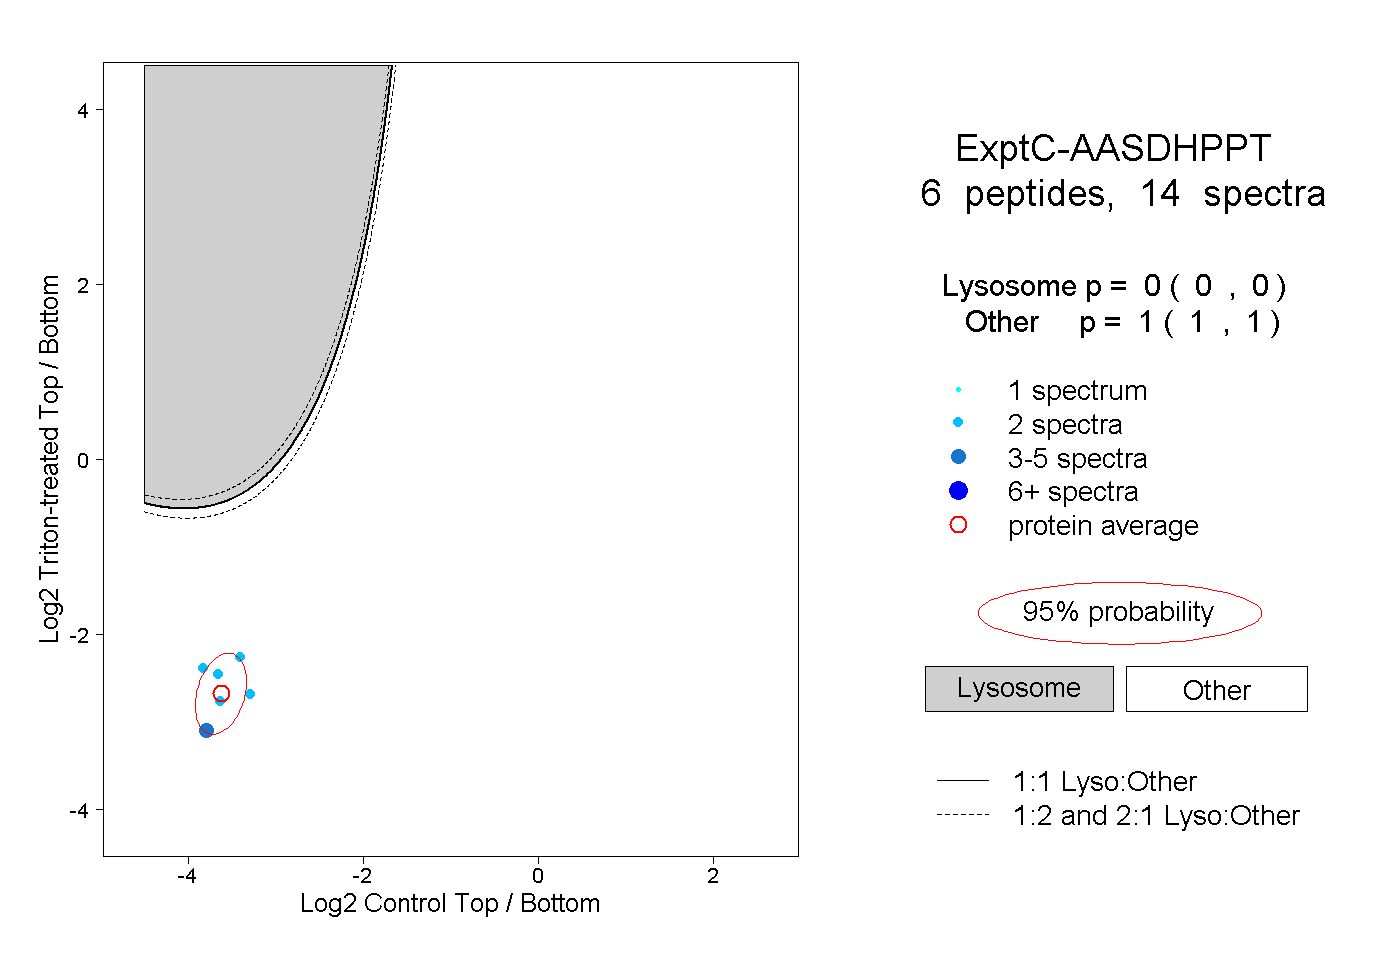 |
0.000 0.000 | 0.000 |
1.000 1.000 | 1.000 |
||||||||
| Plot | Lyso | Other | |||||||||||
| Expt D |
1 peptide |
1 spectrum |
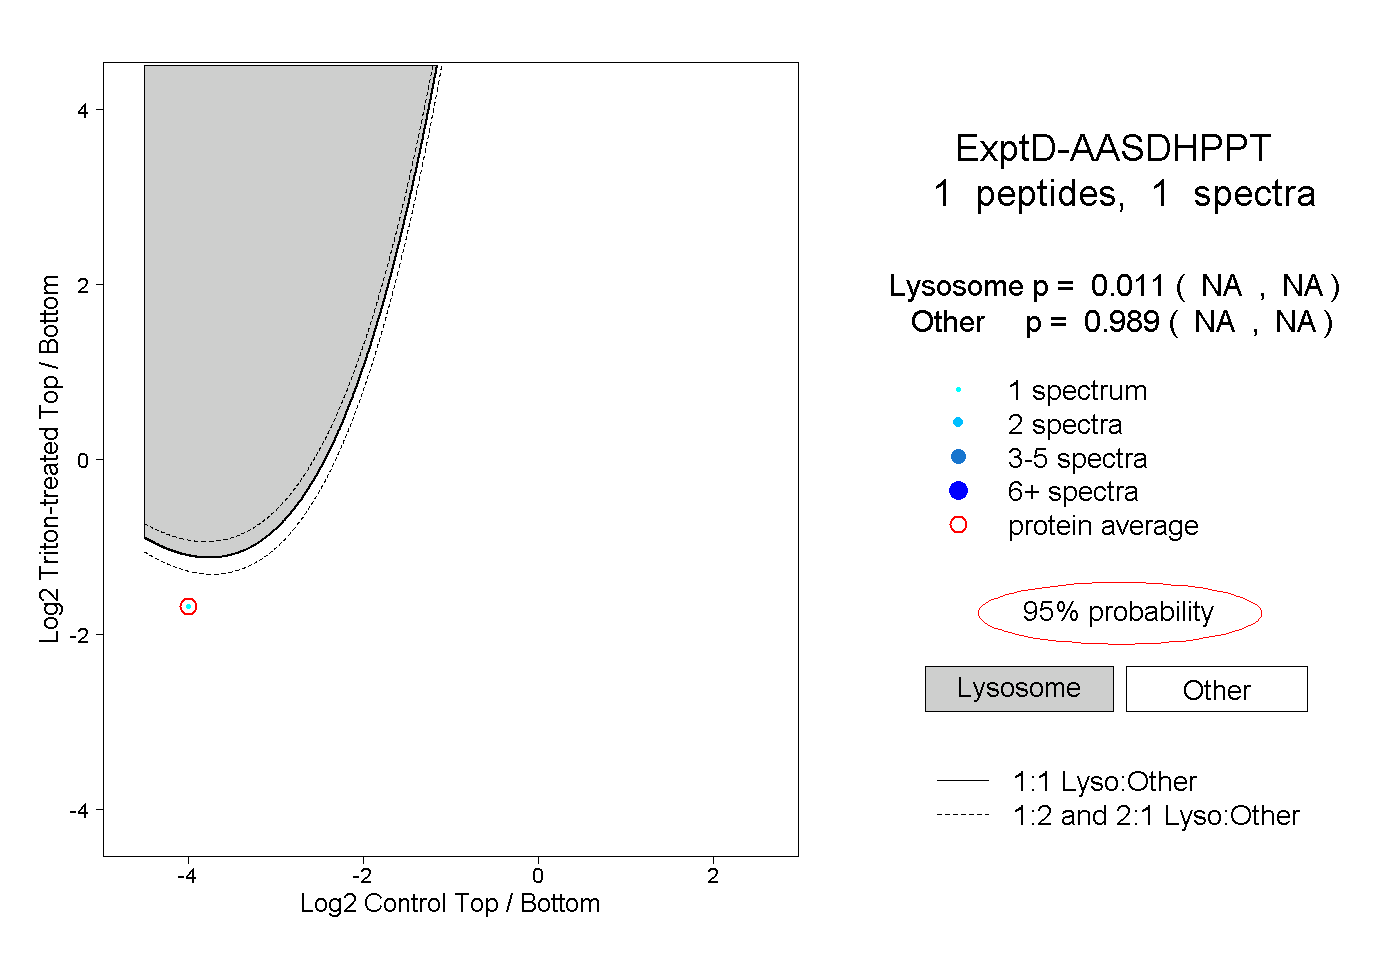 |
0.011 NA | NA |
0.989 NA | NA |