 5
5peptides
spectra
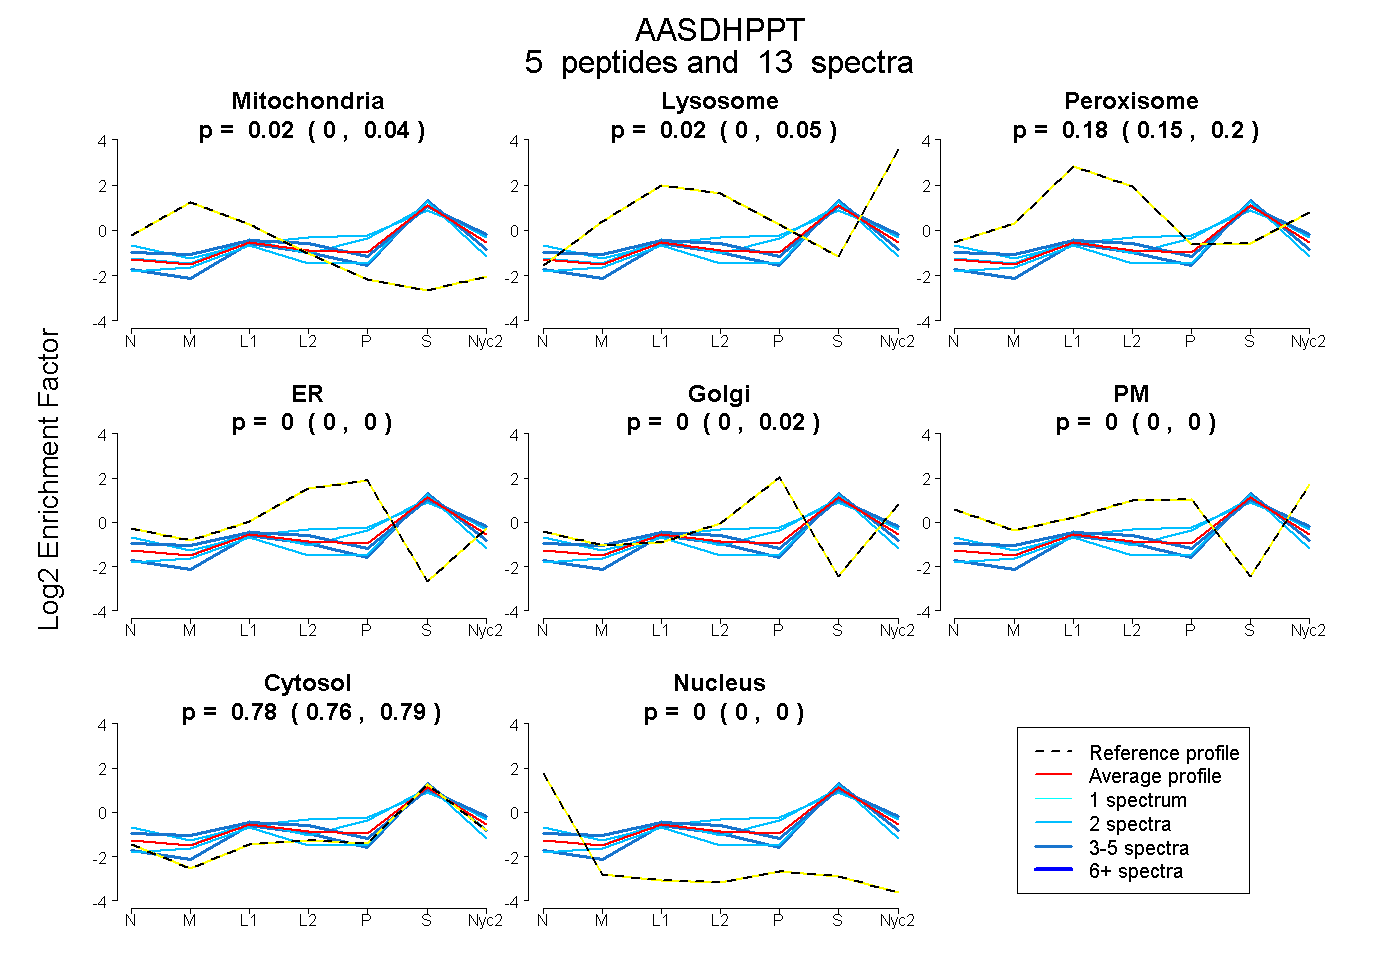
0.000 | 0.037
0.000 | 0.047
0.146 | 0.201
0.000 | 0.000
0.000 | 0.019
0.000 | 0.000
0.764 | 0.791
0.000 | 0.000
2peptides
spectra
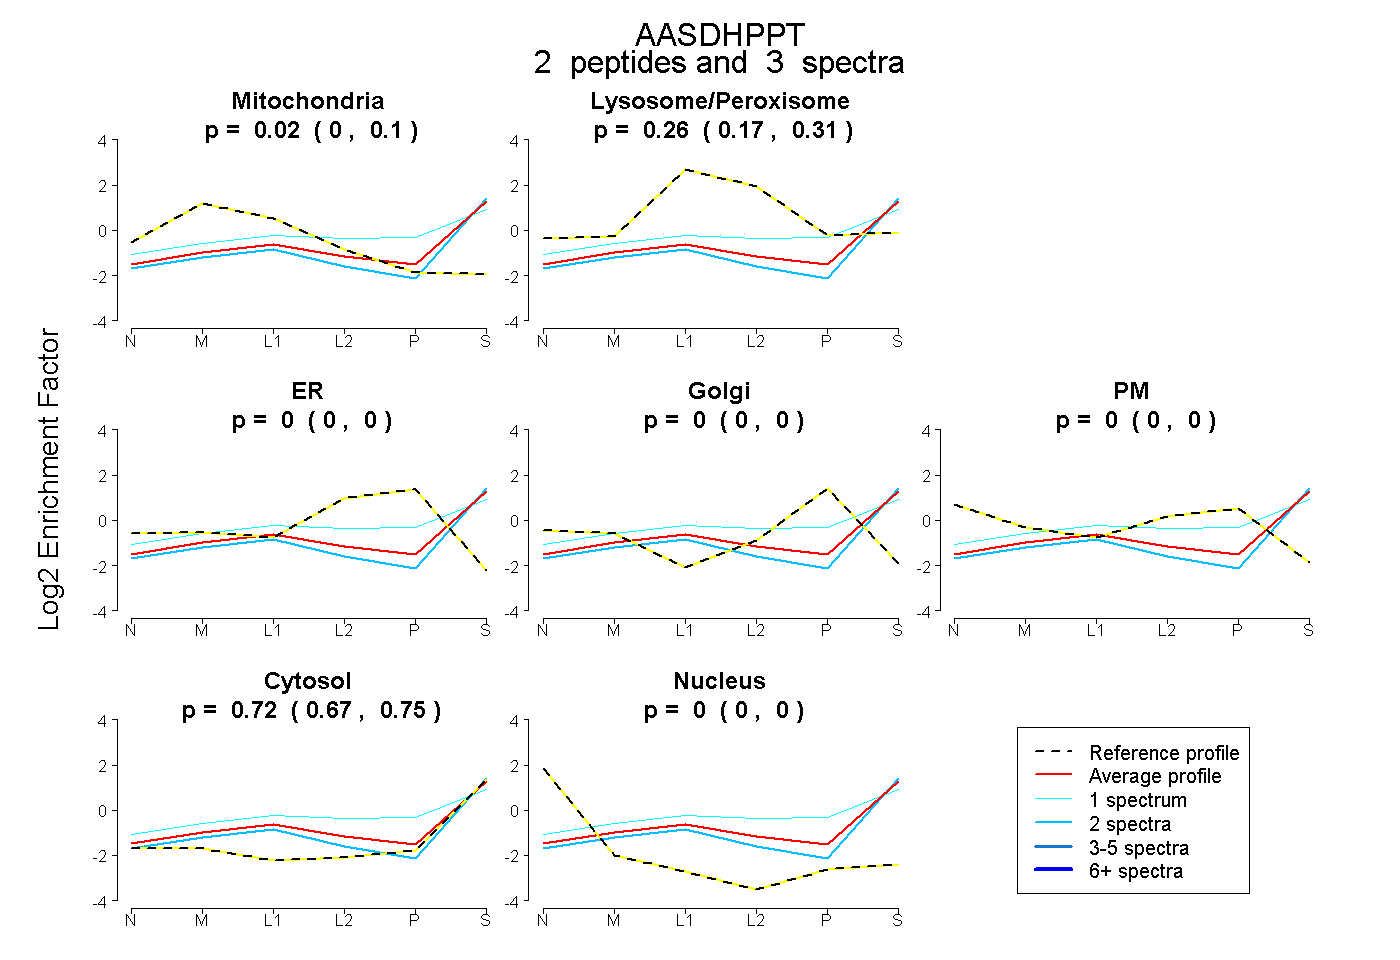
0.000 | 0.096
0.169 | 0.312
0.000 | 0.000
0.000 | 0.004
0.000 | 0.000
0.667 | 0.754
0.000 | 0.000
6peptides
spectra
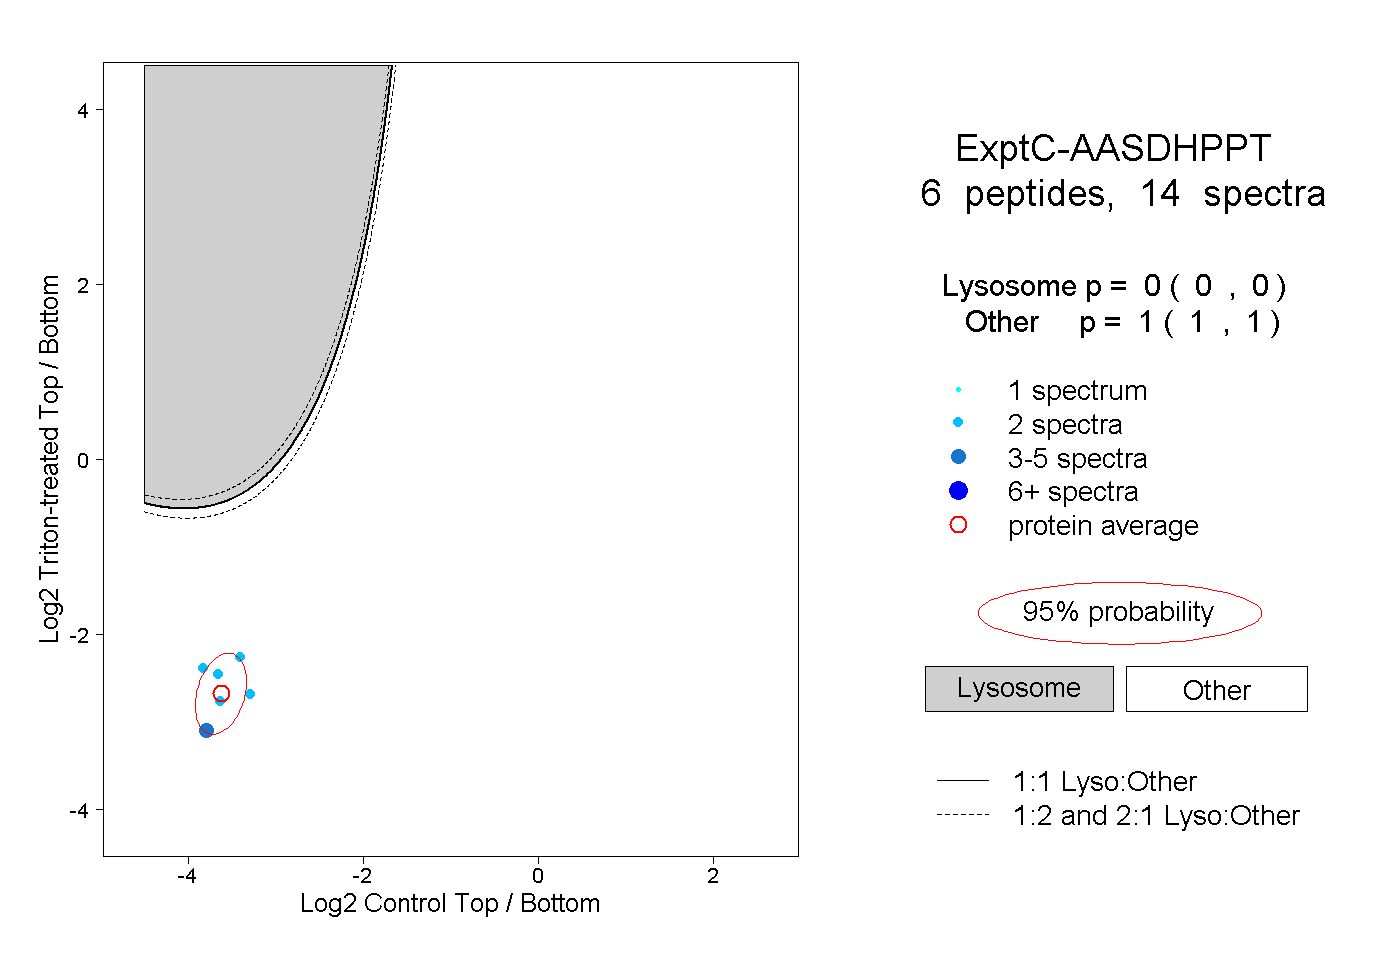
0.000 | 0.000
1.000 | 1.000
1peptide
spectrum
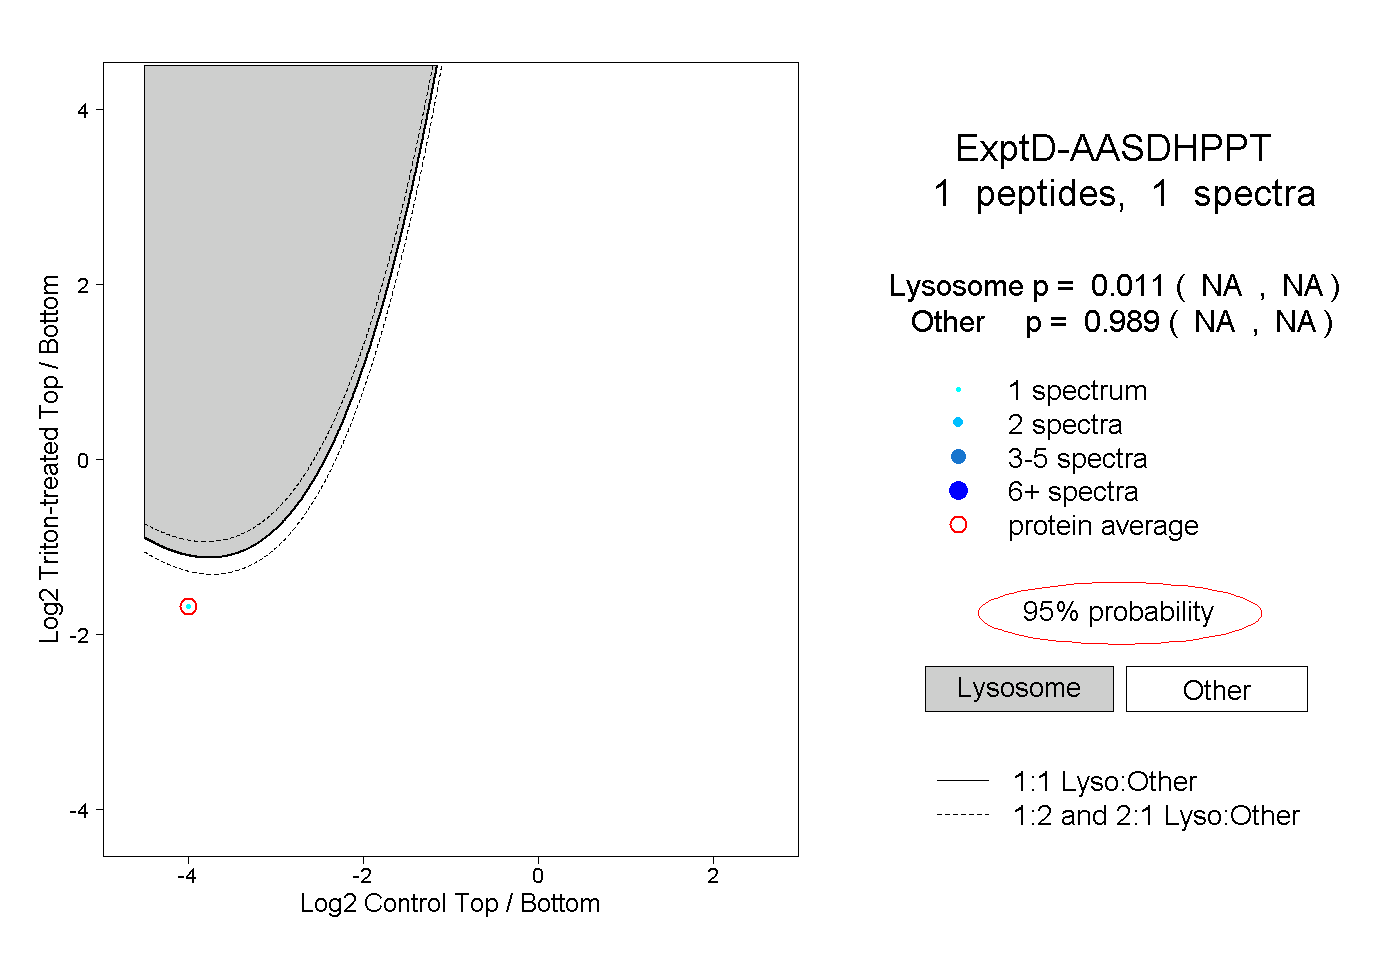
NA | NA
NA | NA