18
18peptides
spectra
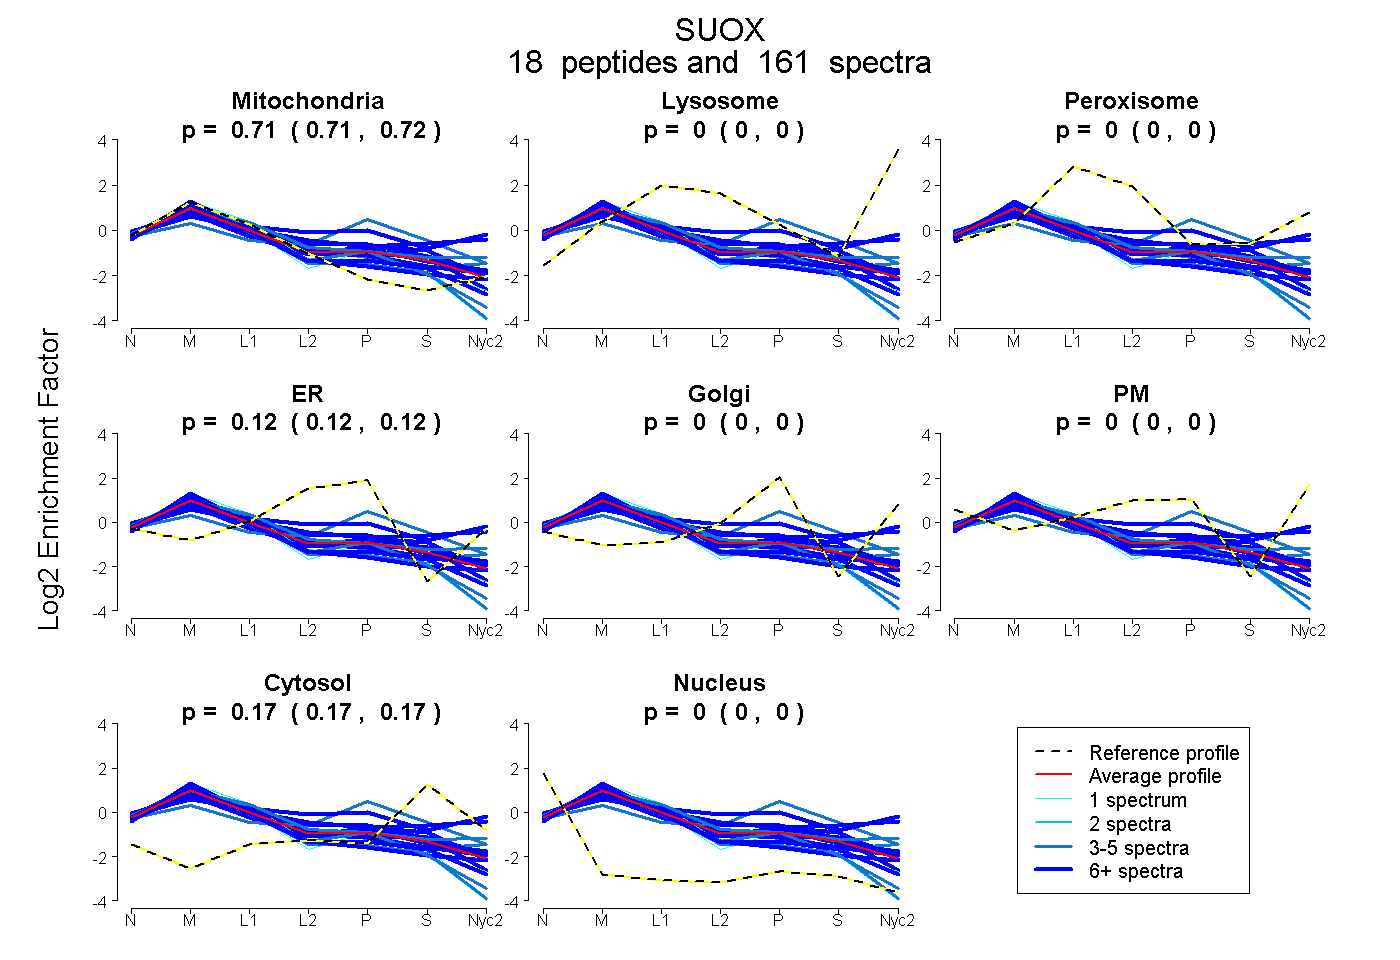
0.708 | 0.715
0.000 | 0.000
0.000 | 0.000
0.117 | 0.124
0.000 | 0.000
0.000 | 0.000
0.165 | 0.170
0.000 | 0.000
14peptides
spectra
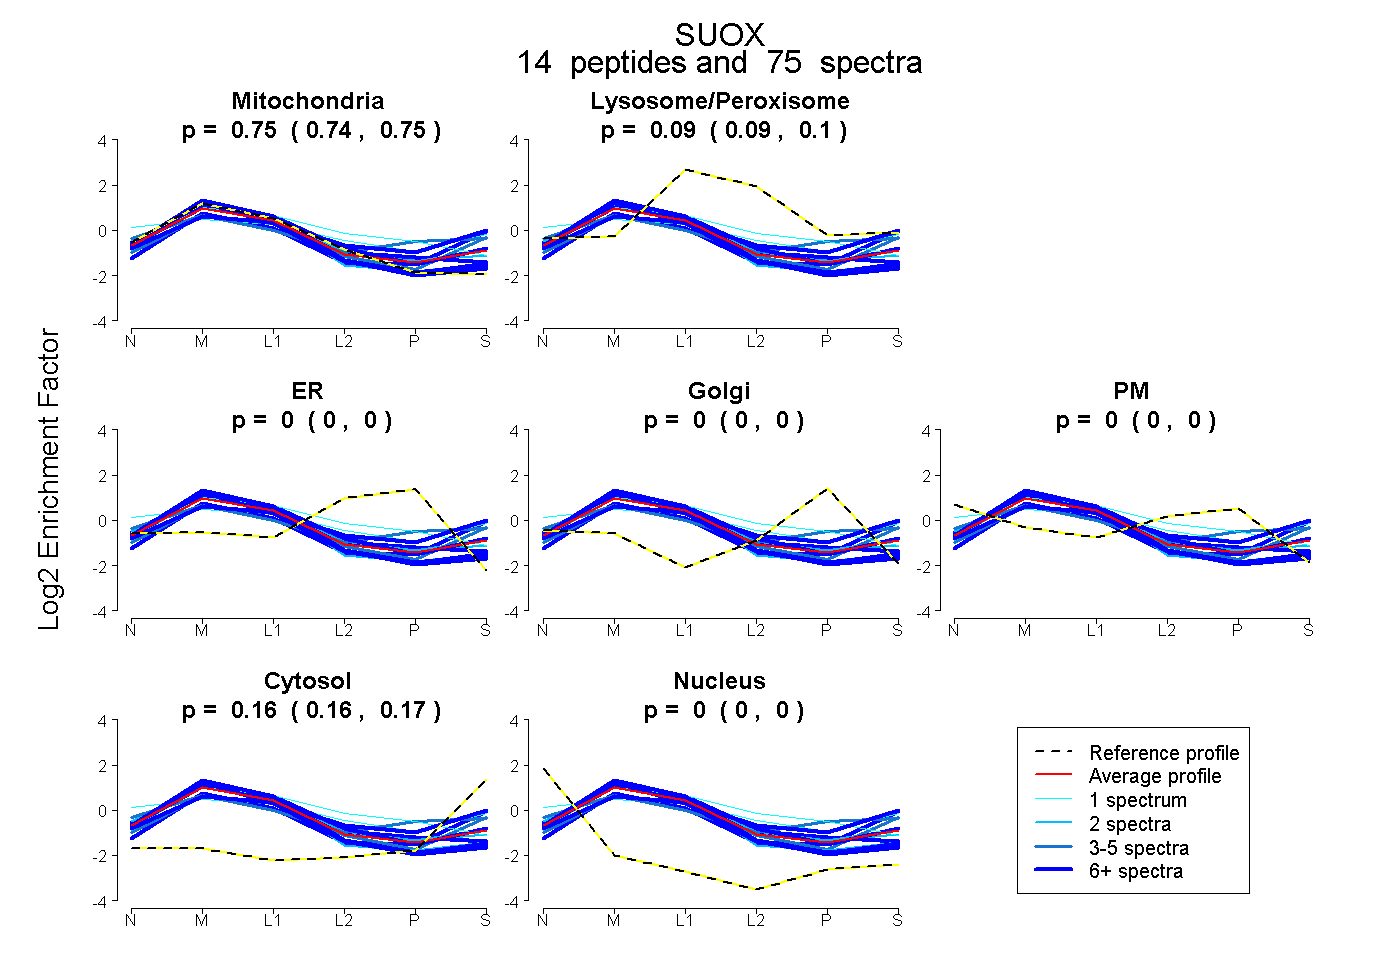
0.737 | 0.752
0.088 | 0.098
0.000 | 0.000
0.000 | 0.000
0.000 | 0.000
0.157 | 0.166
0.000 | 0.000
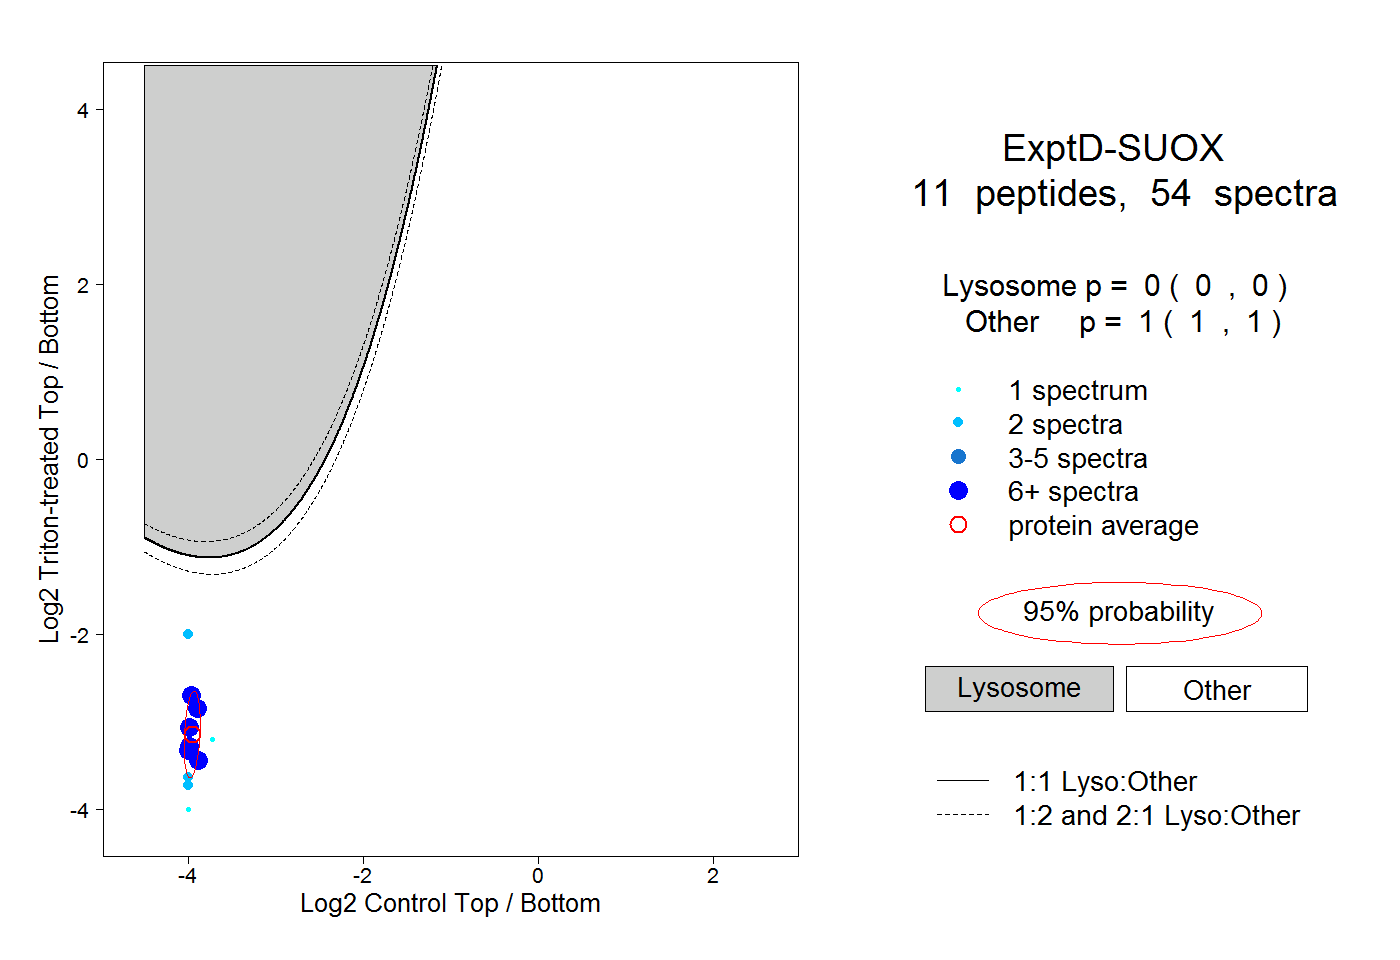
16peptides
spectra
0.000 | 0.000
1.000 | 1.000