 3
3peptides
spectra
0.000 | 0.123
0.000 | 0.130
0.000 | 0.268
0.000 | 0.376
0.000 | 0.316
0.000 | 0.625
0.211 | 0.425
0.000 | 0.133
1peptide
spectrum
NA | NA
NA | NA
NA | NA
NA | NA
NA | NA
NA | NA
NA | NA
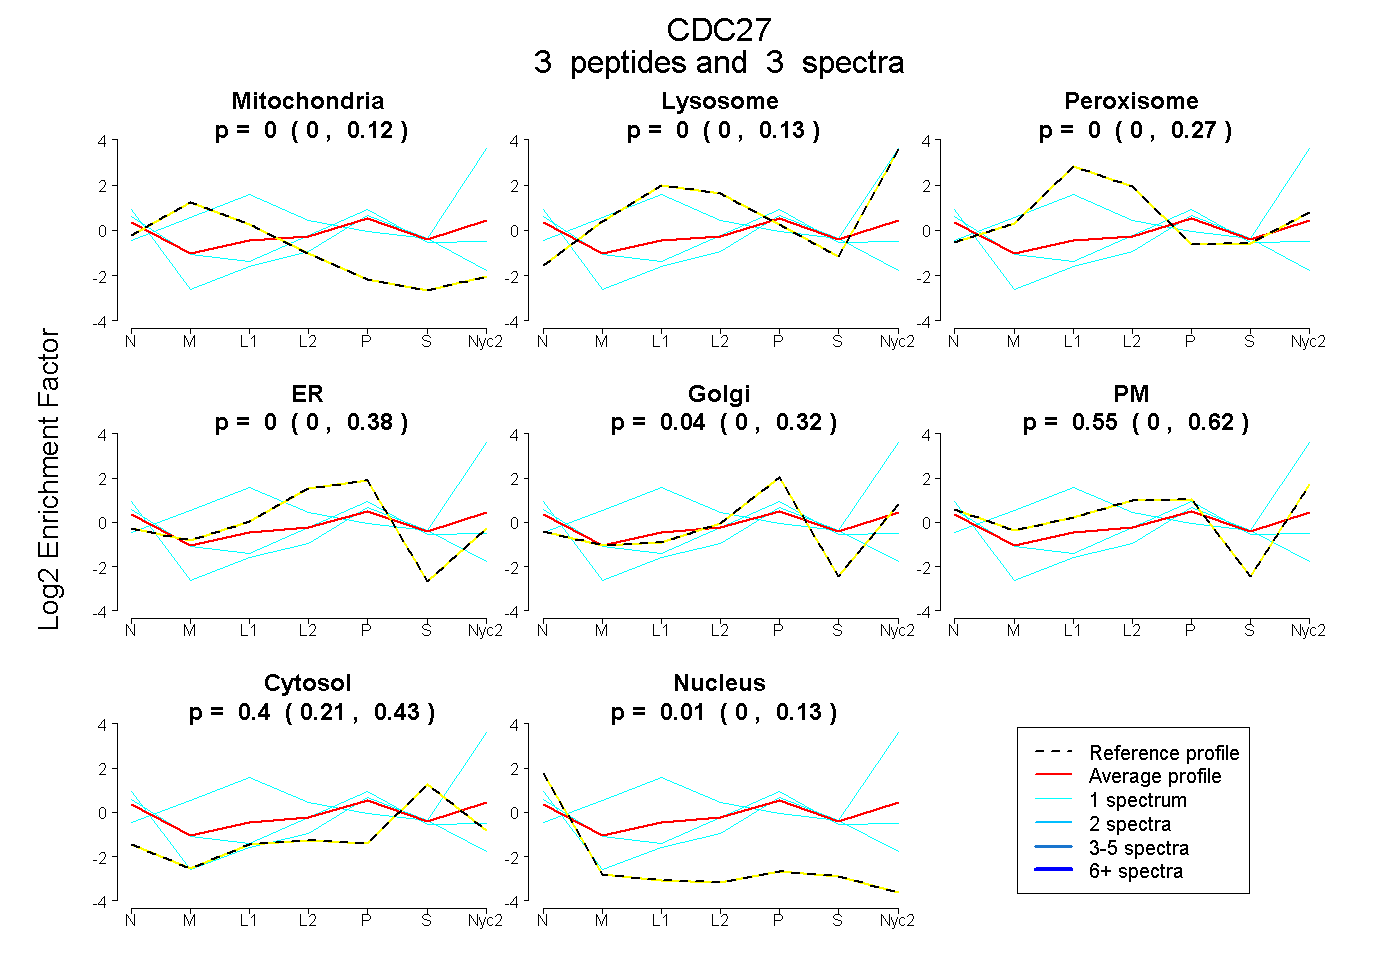
| Plot | Mito | Lyso | Perox | ER | Golgi | PM | Cytosol | Nucleus | |||||
| Expt A |
3 peptides |
3 spectra |
|
0.000 0.000 | 0.123 |
0.000 0.000 | 0.130 |
0.000 0.000 | 0.268 |
0.000 0.000 | 0.376 |
0.039 0.000 | 0.316 |
0.551 0.000 | 0.625 |
0.404 0.211 | 0.425 |
0.006 0.000 | 0.133 |
||
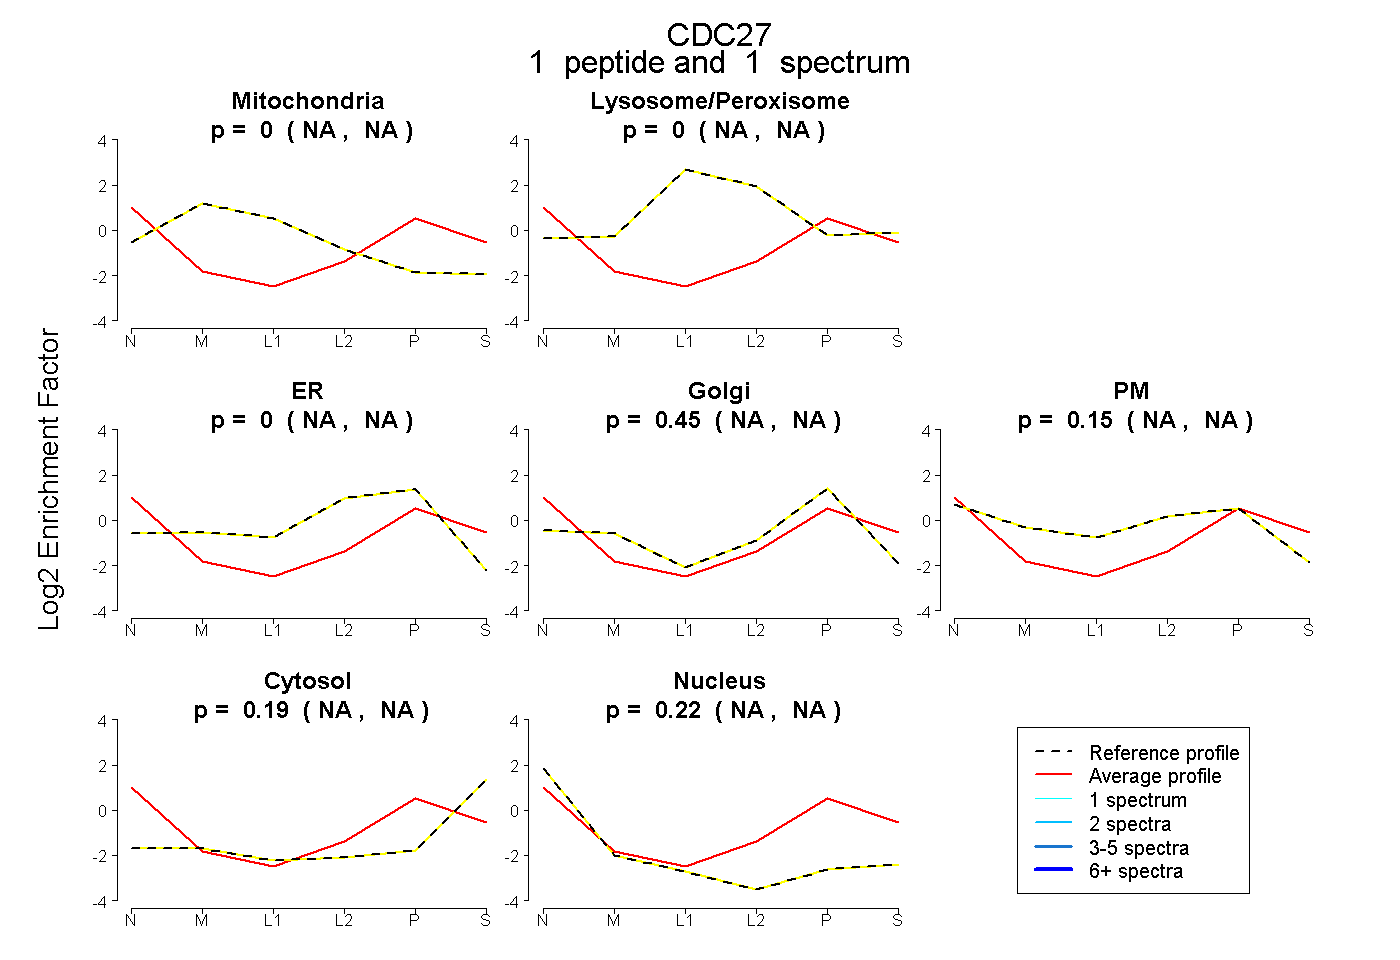
| Plot | Mito | Lyso or Perox | ER | Golgi | PM | Cytosol | Nucleus | ||||||
| Expt B |
1 peptide |
1 spectrum |
|
0.000 NA | NA |
0.000 NA | NA |
0.000 NA | NA |
0.450 NA | NA |
0.146 NA | NA |
0.186 NA | NA |
0.218 NA | NA |