 5
5peptides
spectra
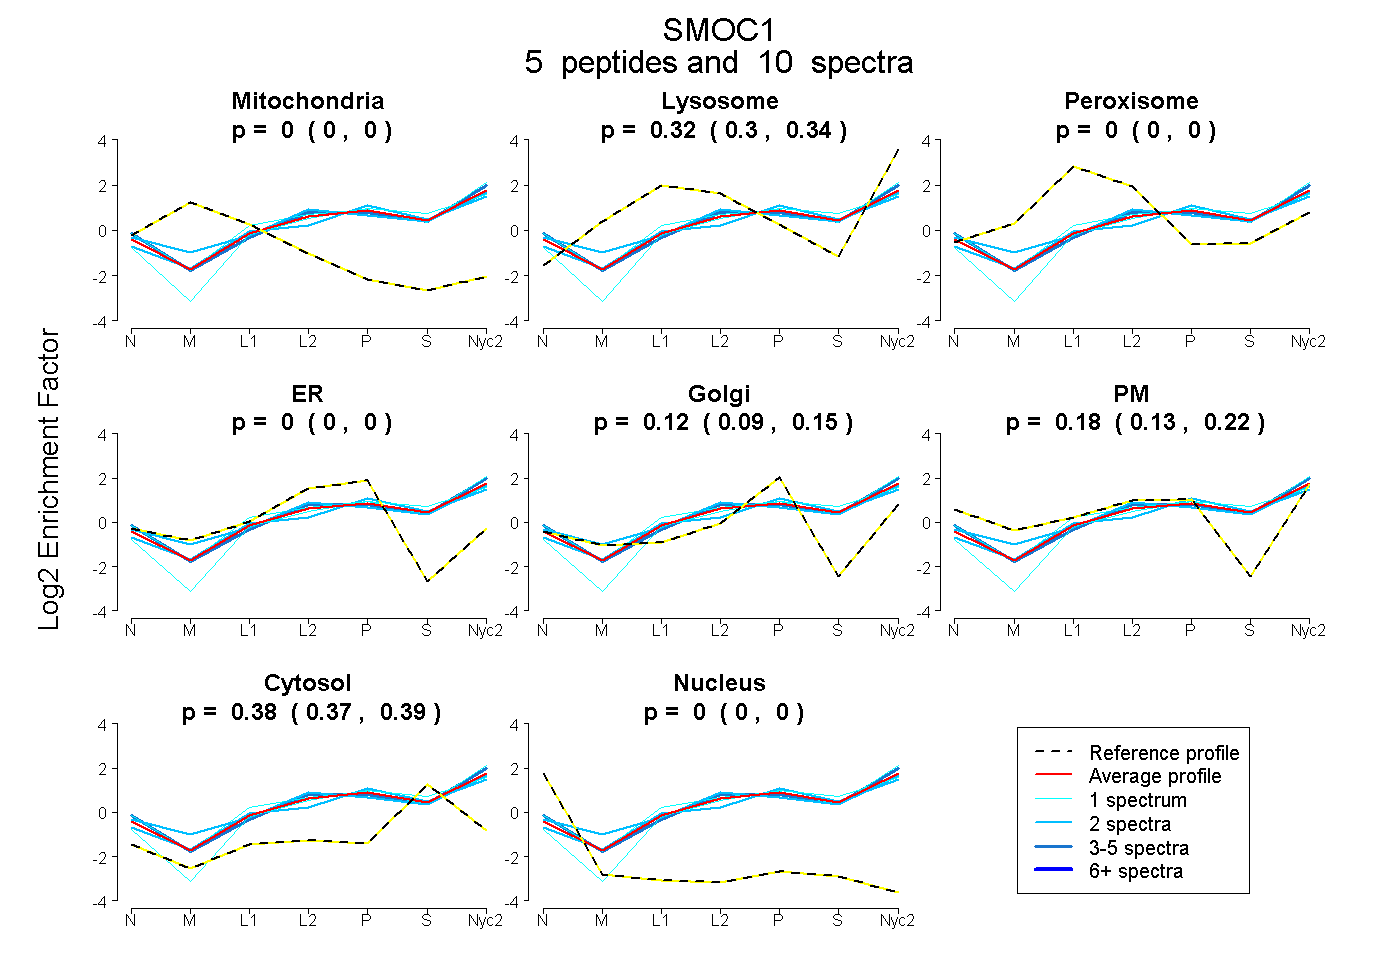
0.000 | 0.000
0.297 | 0.338
0.000 | 0.000
0.000 | 0.000
0.089 | 0.154
0.126 | 0.217
0.370 | 0.390
0.000 | 0.000
| Plot | Mito | Lyso | Perox | ER | Golgi | PM | Cytosol | Nucleus | |||||
| Expt A |
5 peptides |
10 spectra |
|
0.000 0.000 | 0.000 |
0.318 0.297 | 0.338 |
0.000 0.000 | 0.000 |
0.000 0.000 | 0.000 |
0.124 0.089 | 0.154 |
0.176 0.126 | 0.217 |
0.381 0.370 | 0.390 |
0.000 0.000 | 0.000 |
| 2 spectra, VHSCDQER | 0.000 | 0.315 | 0.000 | 0.000 | 0.000 | 0.325 | 0.360 | 0.000 | ||
| 4 spectra, FSEPDPSHTLEER | 0.000 | 0.266 | 0.000 | 0.000 | 0.013 | 0.345 | 0.376 | 0.000 | ||
| 1 spectrum, YVMPSCESDAR | 0.000 | 0.285 | 0.000 | 0.000 | 0.229 | 0.000 | 0.485 | 0.000 | ||
| 1 spectrum, TQPKPICASDGR | 0.000 | 0.334 | 0.000 | 0.000 | 0.016 | 0.304 | 0.345 | 0.000 | ||
| 2 spectra, SYESMCEYQR | 0.000 | 0.336 | 0.000 | 0.000 | 0.276 | 0.000 | 0.388 | 0.000 |
| Plot | Lyso | Other | |||||||||||
| Expt C |
9 peptides |
27 spectra |
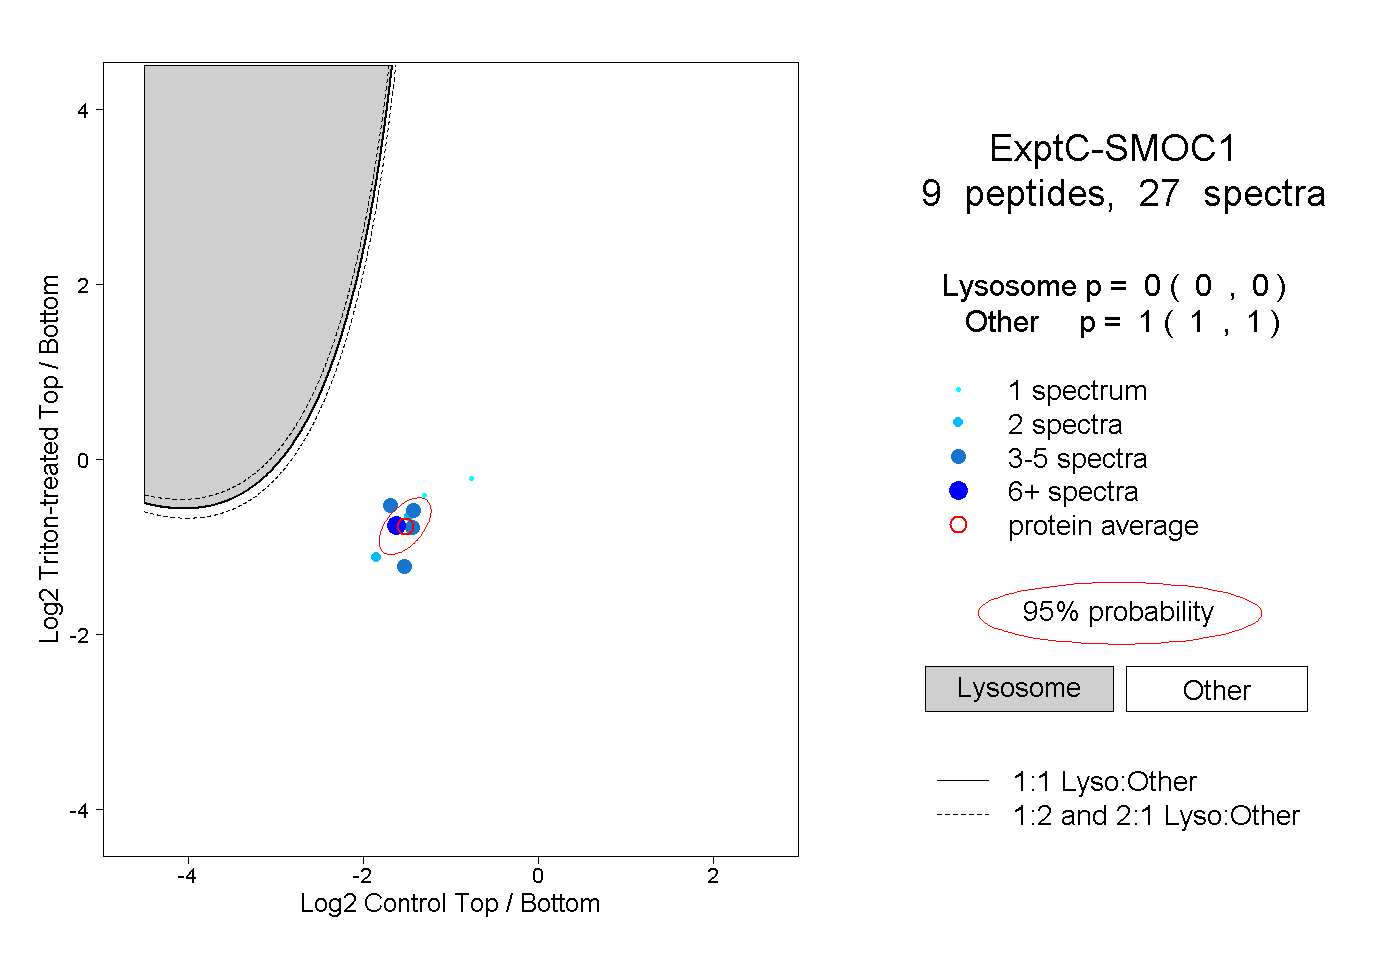 |
0.000 0.000 | 0.000 |
1.000 1.000 | 1.000 |