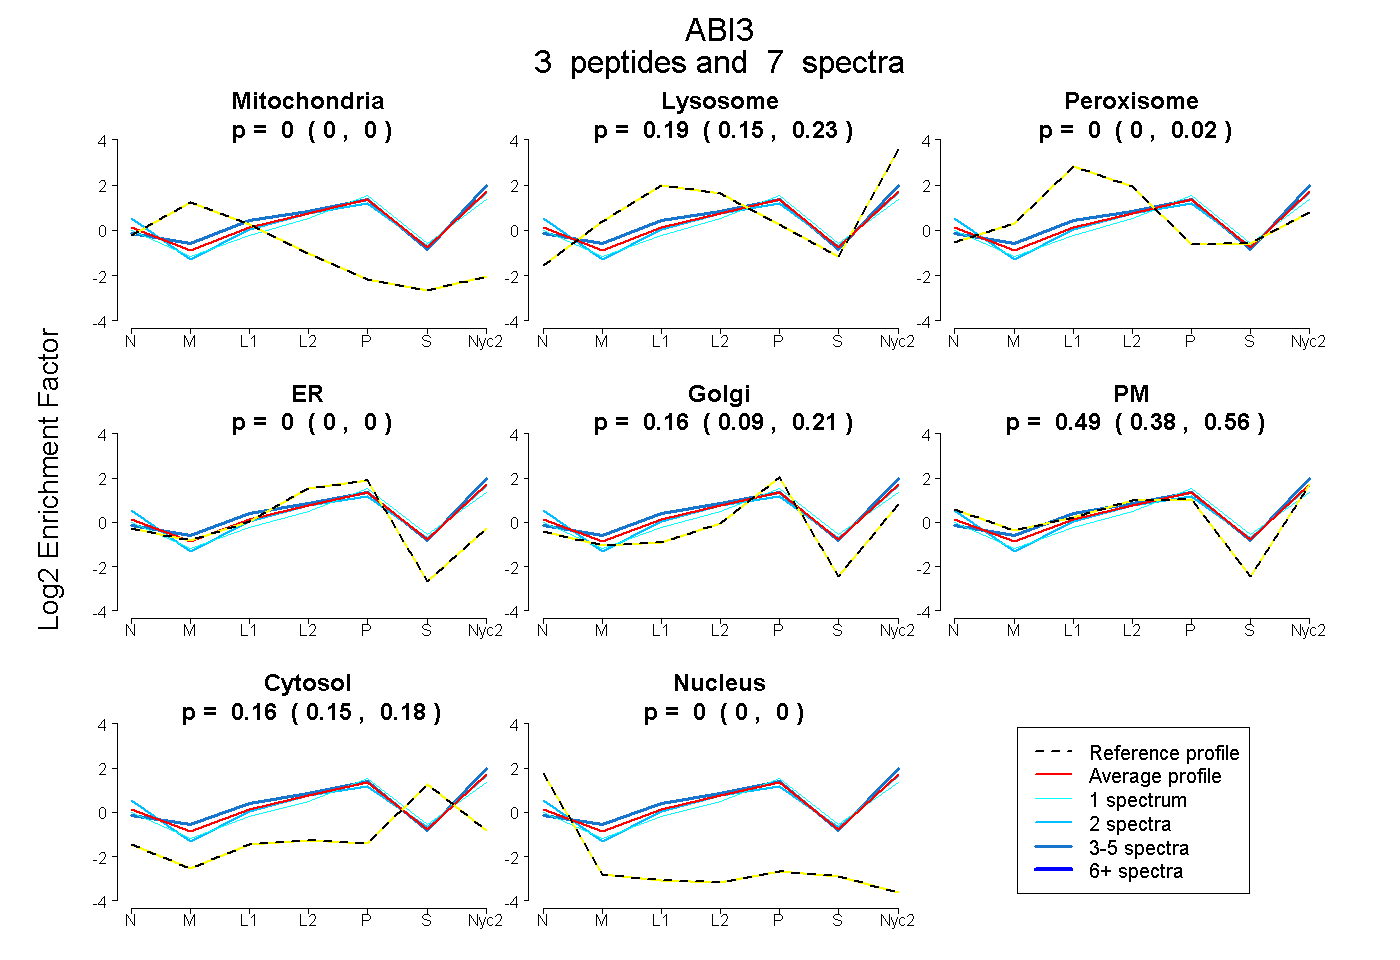
 3
3peptides
spectra
0.000 | 0.000
0.150 | 0.230
0.000 | 0.019
0.000 | 0.000
0.094 | 0.212
0.384 | 0.558
0.146 | 0.177
0.000 | 0.000
| Plot | Mito | Lyso | Perox | ER | Golgi | PM | Cytosol | Nucleus | |||||
| Expt A |
3 peptides |
7 spectra |
|
0.000 0.000 | 0.000 |
0.195 0.150 | 0.230 |
0.000 0.000 | 0.019 |
0.000 0.000 | 0.000 |
0.156 0.094 | 0.212 |
0.485 0.384 | 0.558 |
0.163 0.146 | 0.177 |
0.000 0.000 | 0.000 |
| 1 spectrum, KPLNFACLDDVGHGVK | 0.000 | 0.146 | 0.000 | 0.000 | 0.335 | 0.312 | 0.206 | 0.000 | ||
| 4 spectra, APATPASATLGRPPR | 0.000 | 0.333 | 0.000 | 0.000 | 0.217 | 0.340 | 0.110 | 0.000 | ||
| 2 spectra, EIGTLATVVR | 0.000 | 0.074 | 0.000 | 0.000 | 0.000 | 0.712 | 0.214 | 0.000 |
| Plot | Lyso | Other | |||||||||||
| Expt C |
2 peptides |
3 spectra |
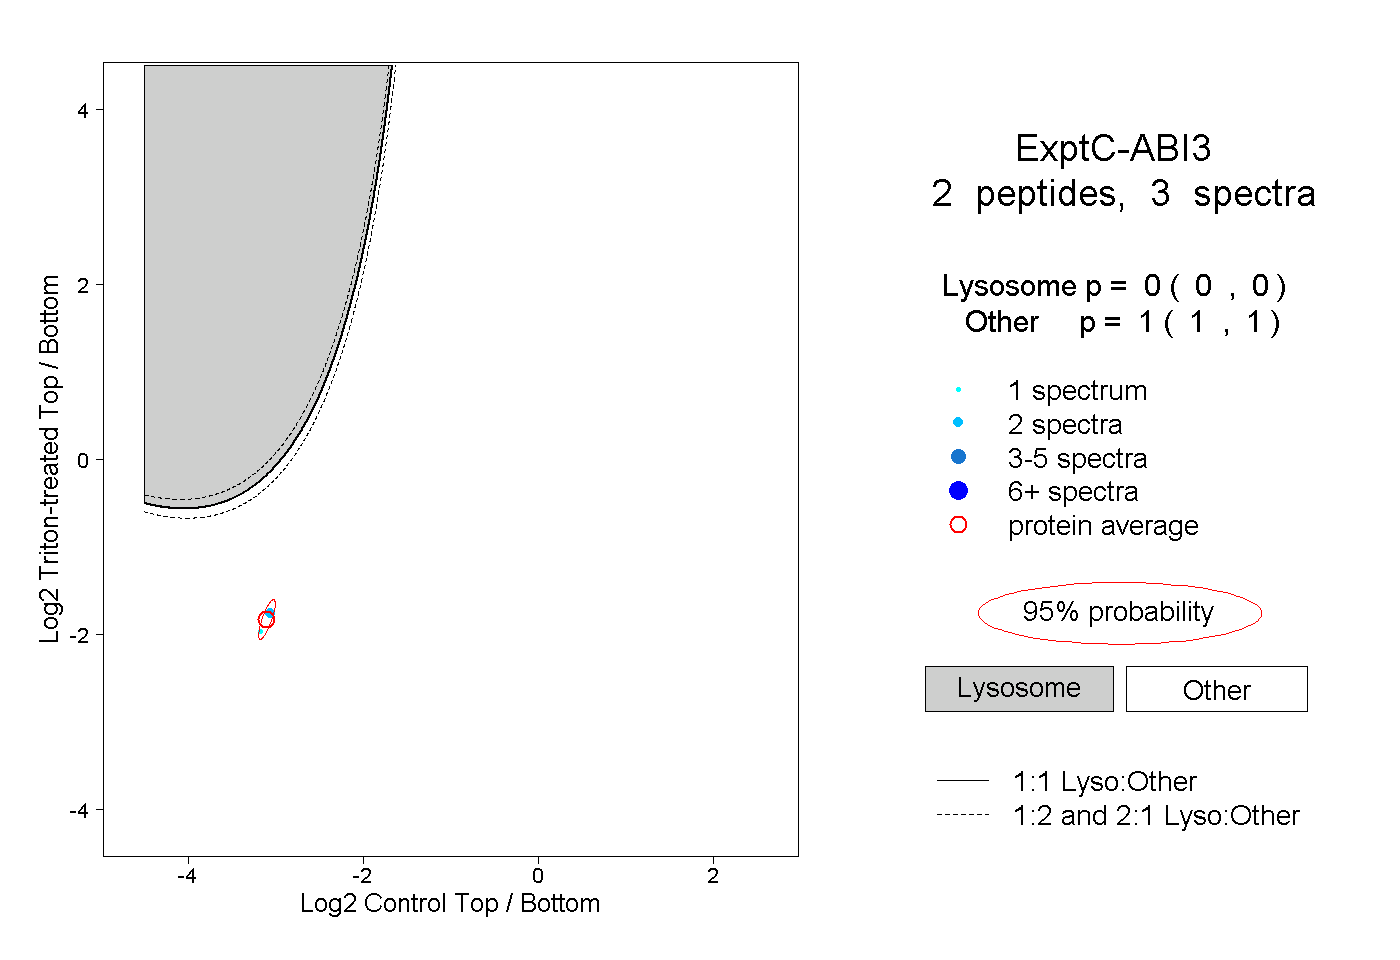 |
0.000 0.000 | 0.000 |
1.000 1.000 | 1.000 |