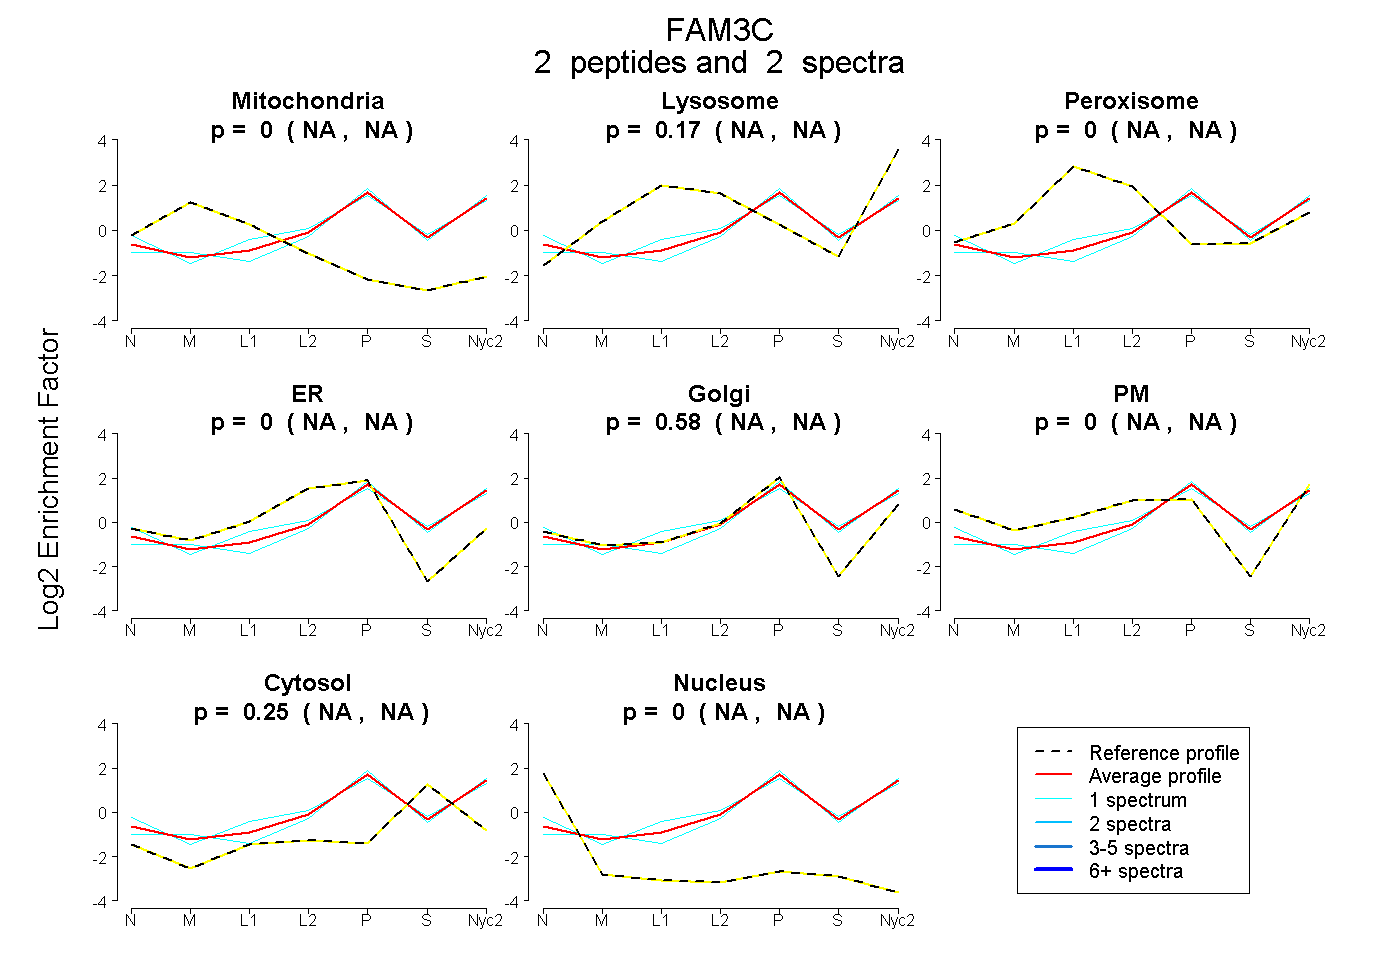
 2
2peptides
spectra
NA | NA
NA | NA
NA | NA
NA | NA
NA | NA
NA | NA
NA | NA
NA | NA
| Plot | Mito | Lyso | Perox | ER | Golgi | PM | Cytosol | Nucleus | |||||
| Expt A |
2 peptides |
2 spectra |
|
0.000 NA | NA |
0.169 NA | NA |
0.000 NA | NA |
0.000 NA | NA |
0.583 NA | NA |
0.000 NA | NA |
0.247 NA | NA |
0.000 NA | NA |
| 1 spectrum, TIQDGTVVLMATYDDGATK | 0.000 | 0.130 | 0.000 | 0.000 | 0.645 | 0.000 | 0.225 | 0.000 | ||
| 1 spectrum, SPFEQHIK | 0.000 | 0.186 | 0.000 | 0.000 | 0.471 | 0.069 | 0.275 | 0.000 |
| Plot | Lyso | Other | |||||||||||
| Expt C |
3 peptides |
9 spectra |
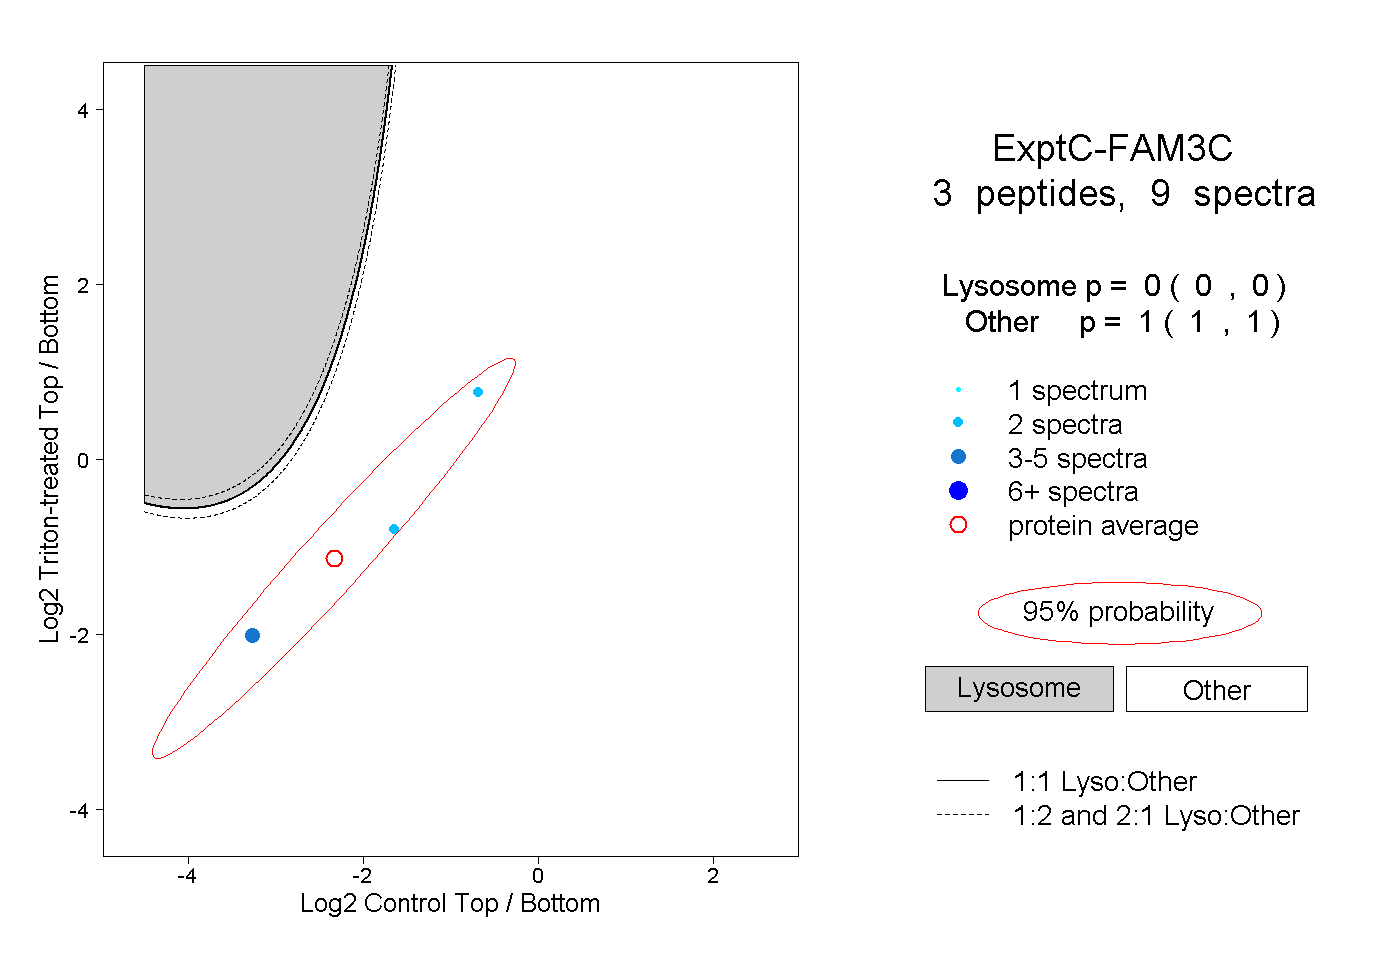 |
0.000 0.000 | 0.000 |
1.000 1.000 | 1.000 |