 1
1peptide
spectra
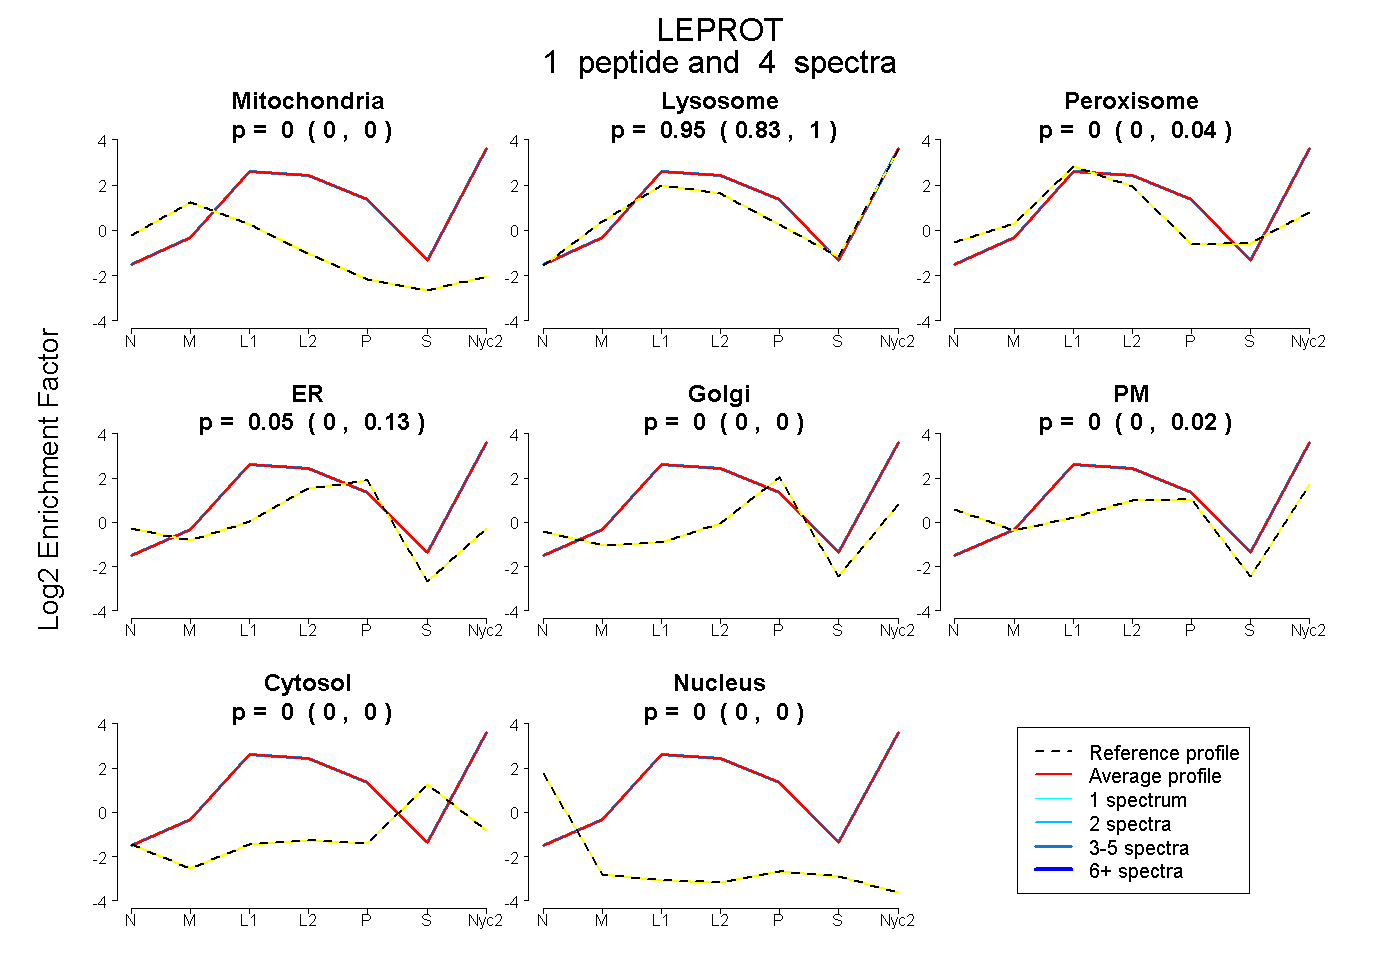
0.000 | 0.000
0.835 | 1.000
0.000 | 0.044
0.000 | 0.128
0.000 | 0.000
0.000 | 0.016
0.000 | 0.000
0.000 | 0.000
1peptide
spectrum
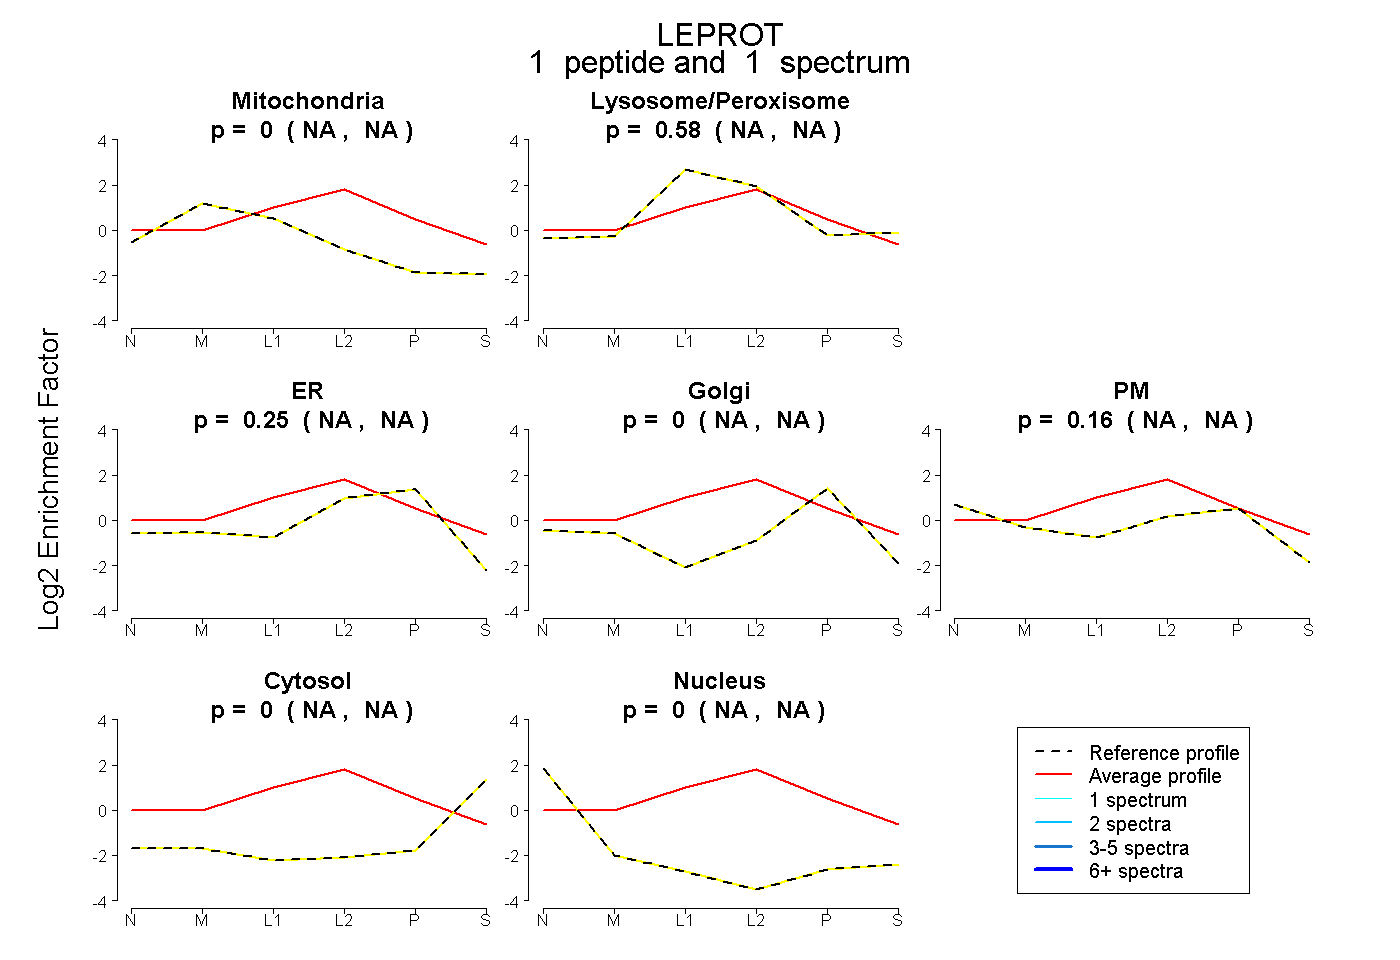
NA | NA
NA | NA
NA | NA
NA | NA
NA | NA
NA | NA
NA | NA
1peptide
spectra
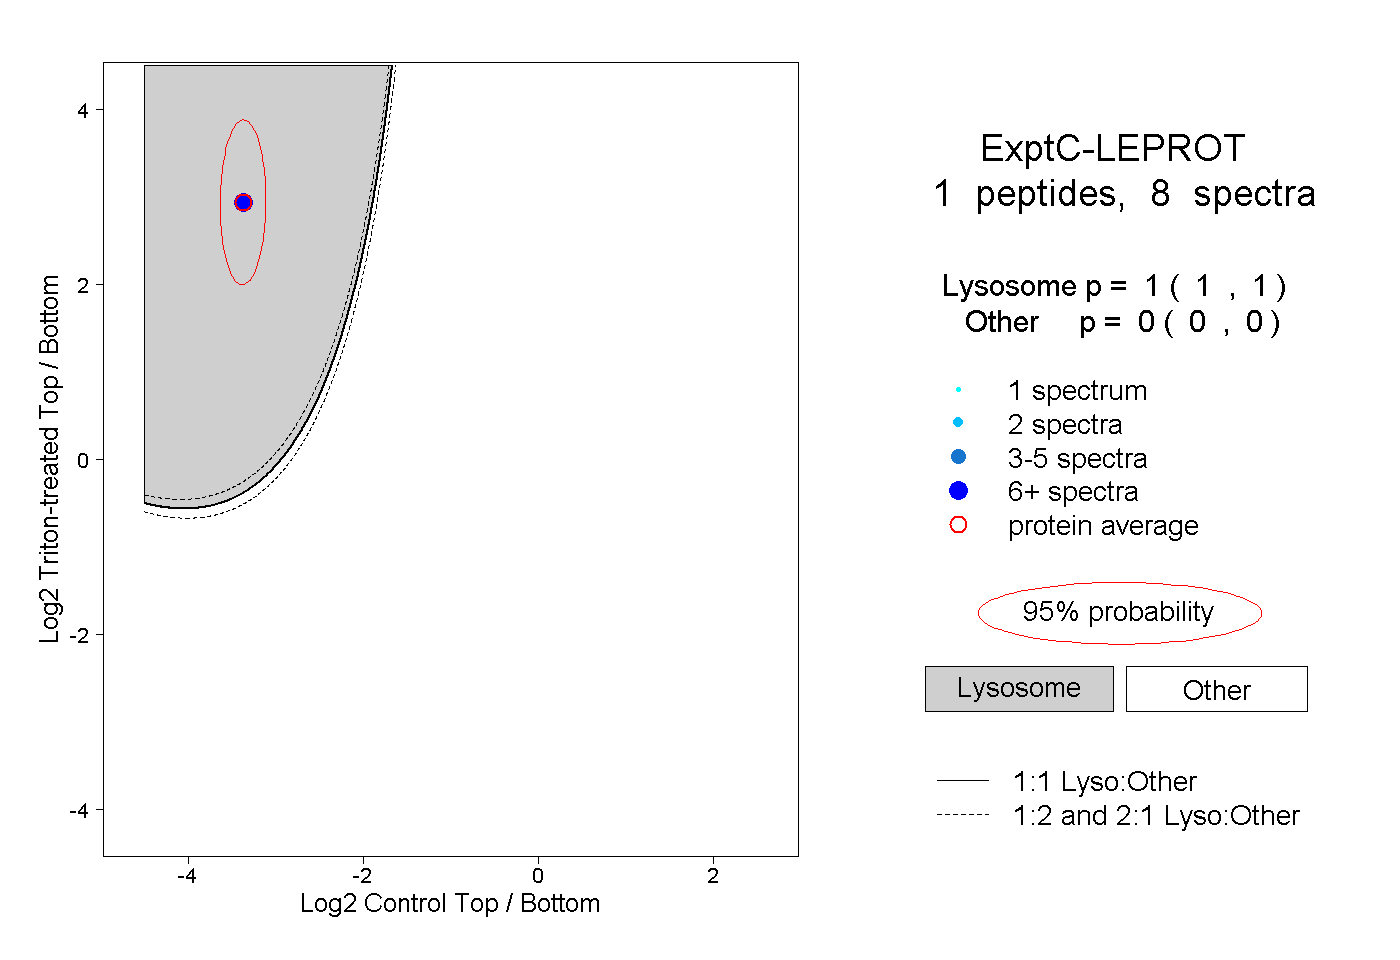
1.000 | 1.000
0.000 | 0.000