 1
1peptide
spectra
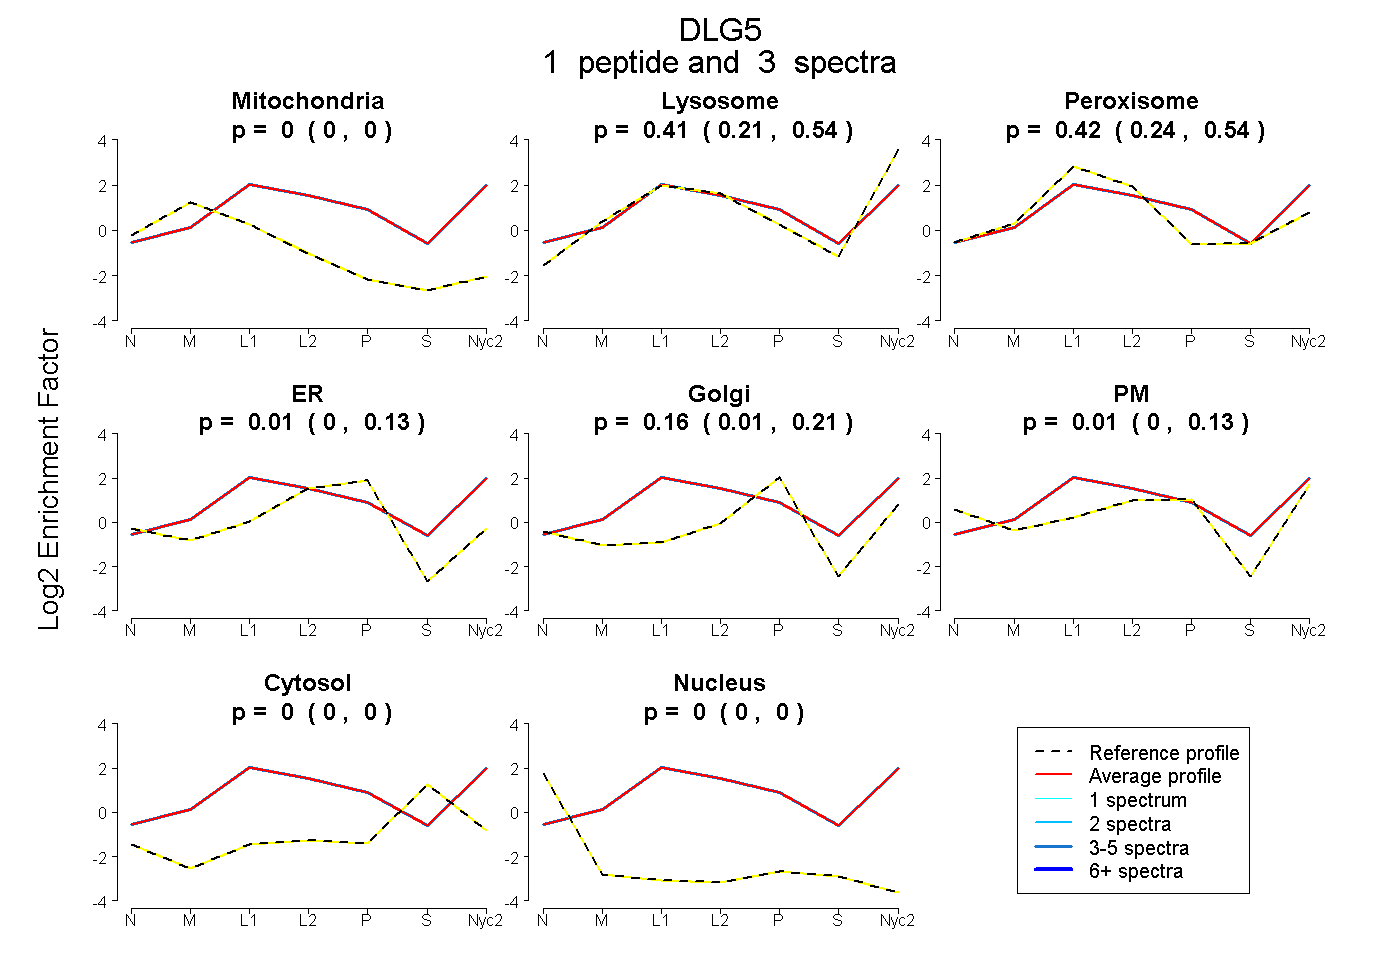
0.000 | 0.000
0.211 | 0.544
0.237 | 0.537
0.000 | 0.127
0.006 | 0.206
0.000 | 0.132
0.000 | 0.000
0.000 | 0.000
1peptide
spectra
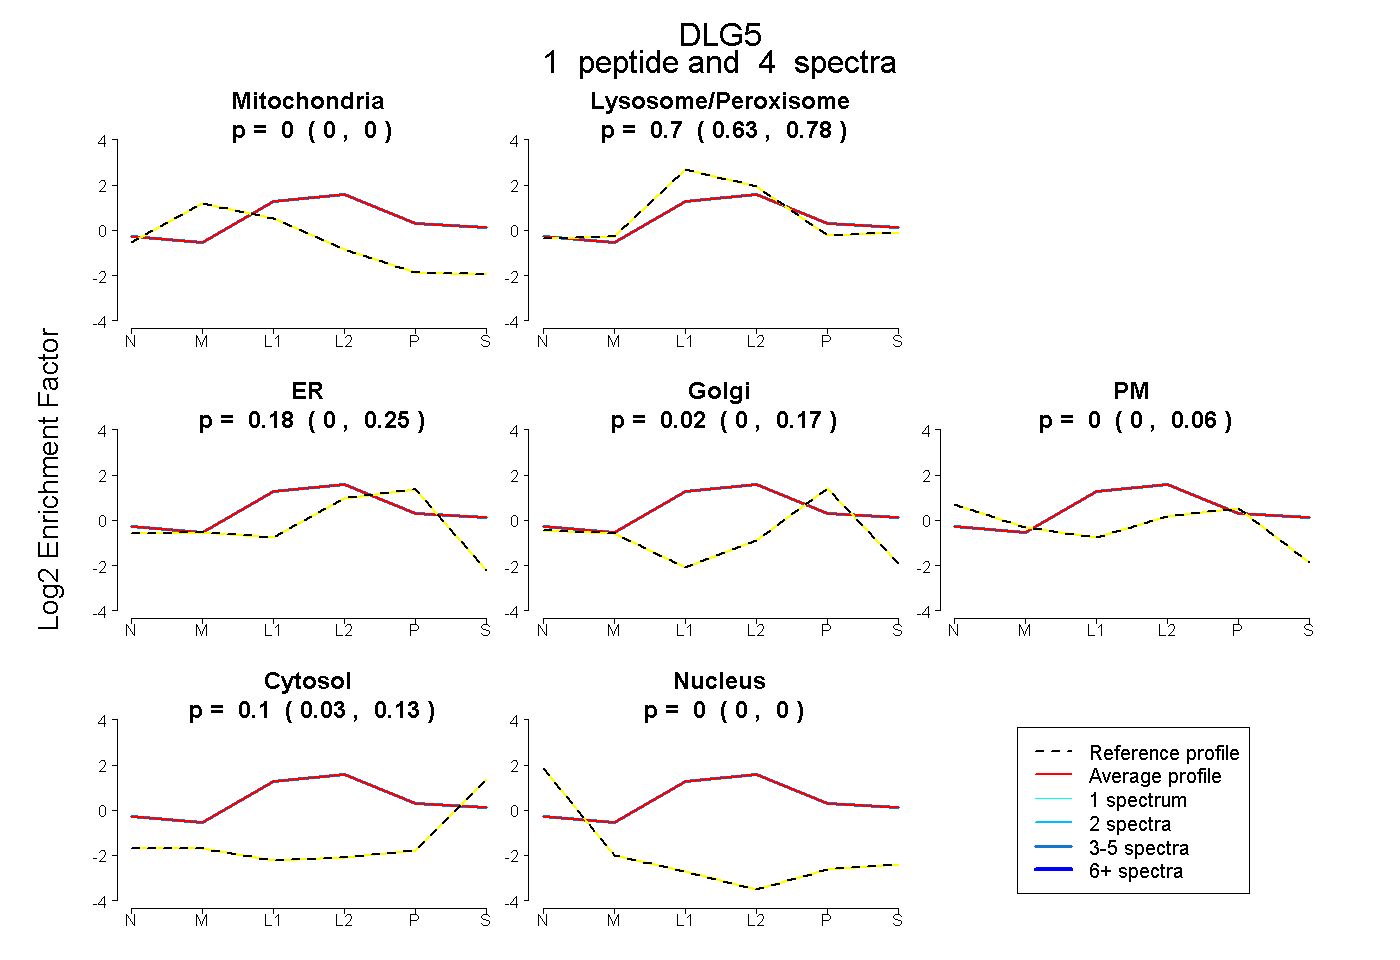
0.000 | 0.000
0.626 | 0.781
0.000 | 0.251
0.000 | 0.169
0.000 | 0.065
0.035 | 0.131
0.000 | 0.000