 1
1peptide
spectra
NA | NA
NA | NA
NA | NA
NA | NA
NA | NA
NA | NA
NA | NA
NA | NA
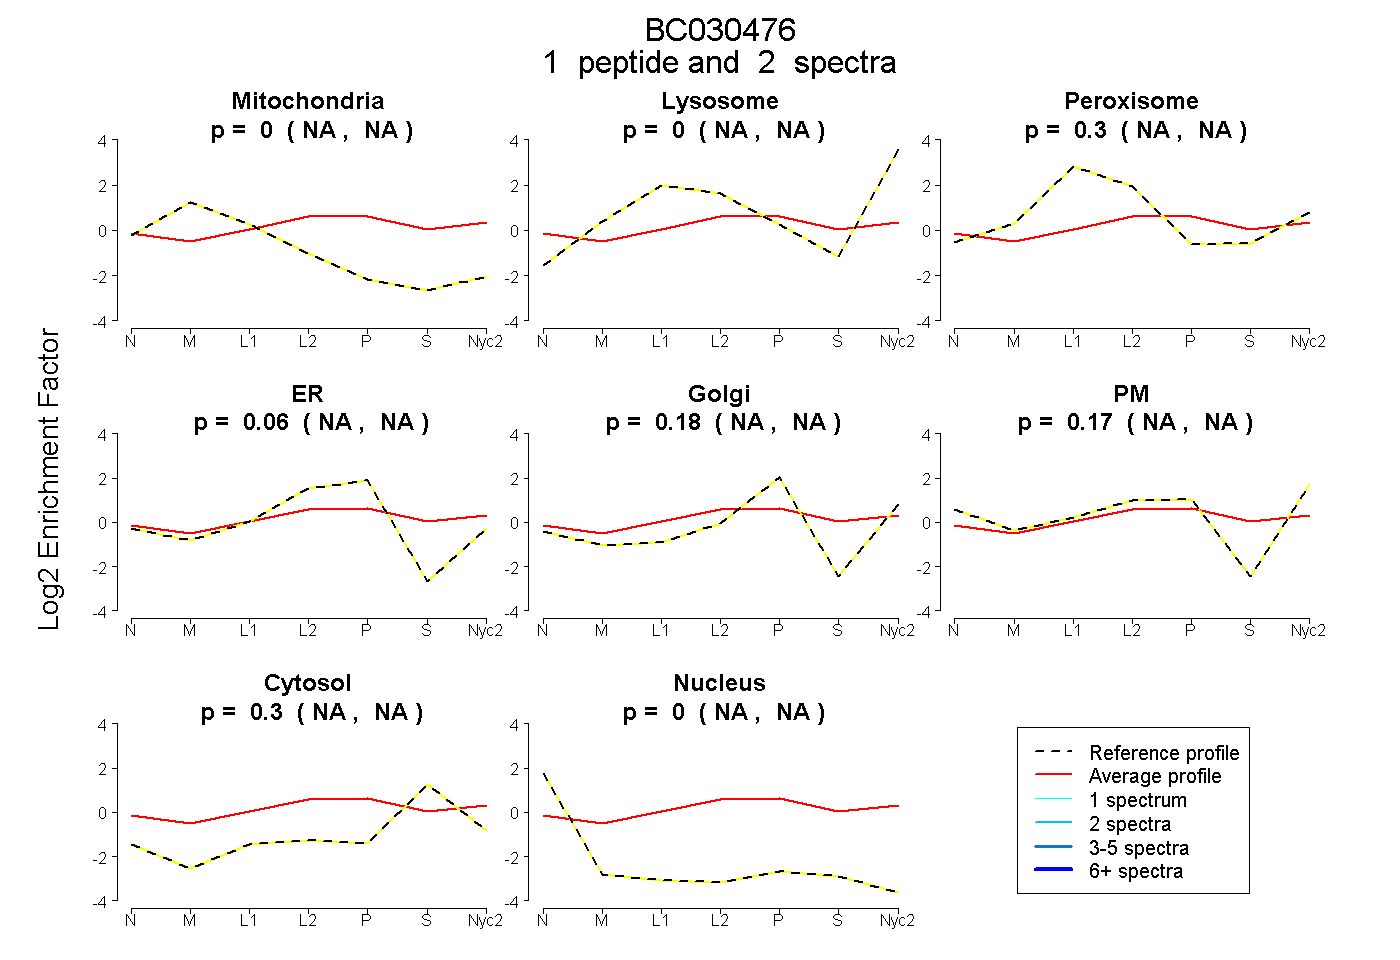
| Plot | Mito | Lyso | Perox | ER | Golgi | PM | Cytosol | Nucleus | |||||
| Expt A |
1 peptide |
2 spectra |
|
0.000 NA | NA |
0.000 NA | NA |
0.297 NA | NA |
0.059 NA | NA |
0.177 NA | NA |
0.168 NA | NA |
0.300 NA | NA |
0.000 NA | NA |
| 2 spectra, AETEPLR | 0.000 | 0.000 | 0.297 | 0.059 | 0.177 | 0.168 | 0.300 | 0.000 |
| Plot | Lyso | Other | |||||||||||
| Expt C |
1 peptide |
1 spectrum |
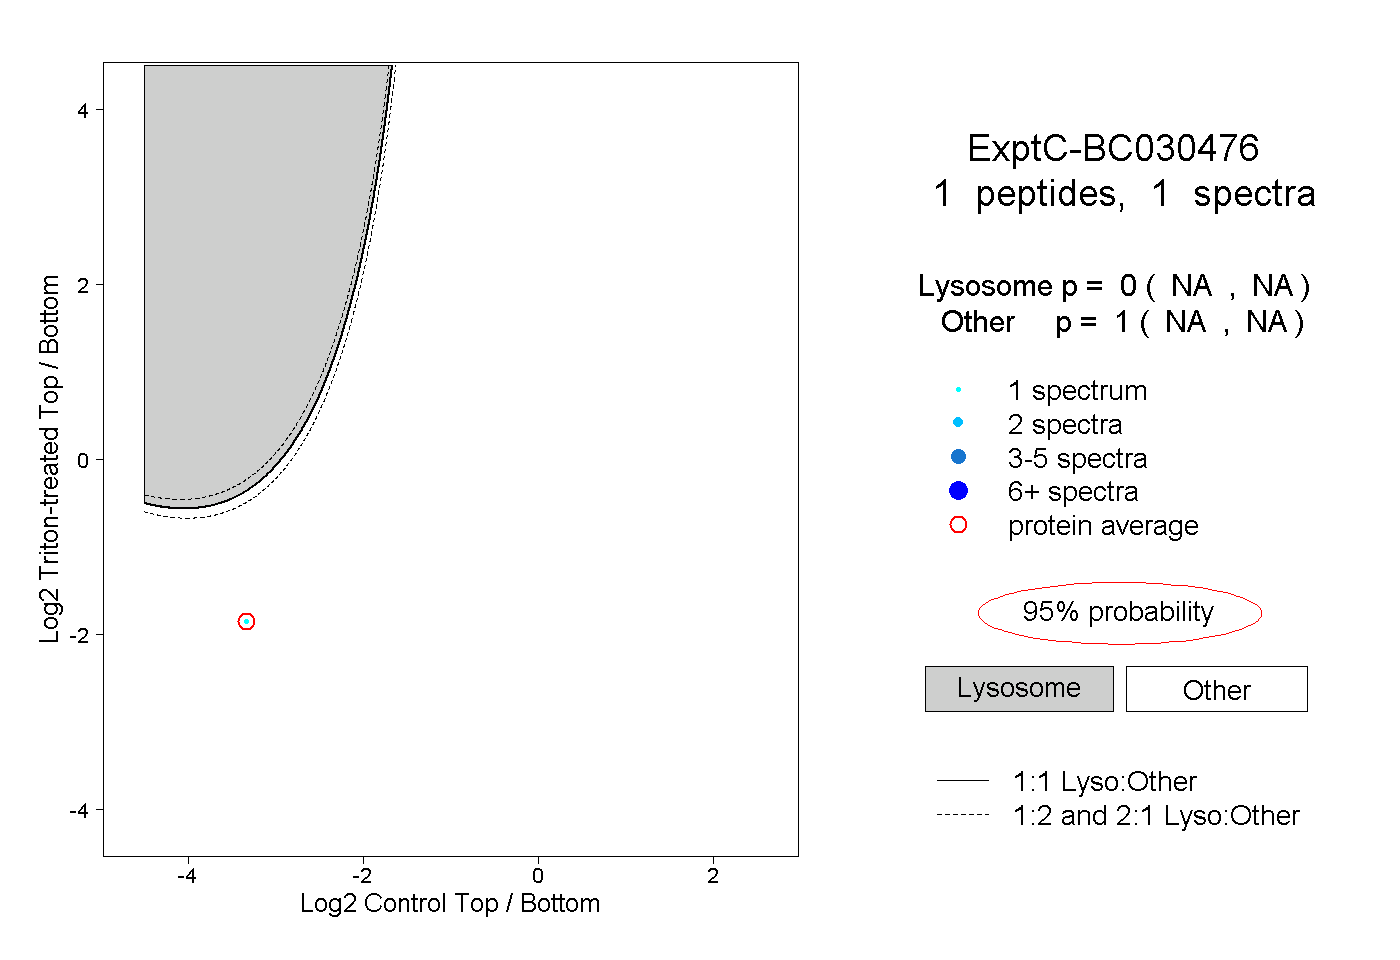 |
0.000 NA | NA |
1.000 NA | NA |