 5
5peptides
spectra
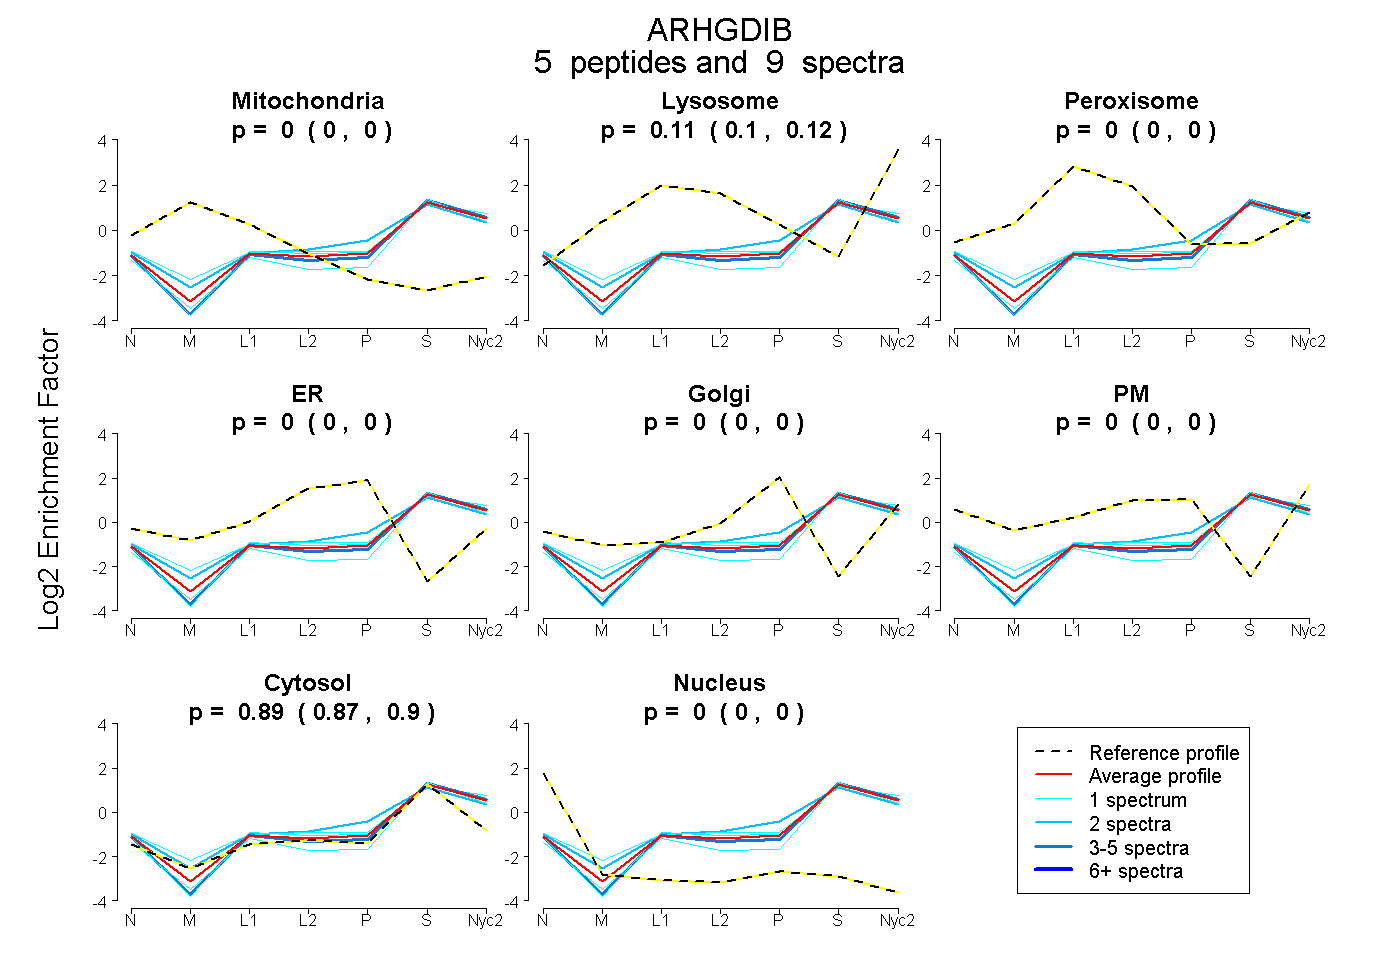
0.000 | 0.000
0.100 | 0.124
0.000 | 0.000
0.000 | 0.000
0.000 | 0.000
0.000 | 0.000
0.873 | 0.898
0.000 | 0.000
| Plot | Mito | Lyso | Perox | ER | Golgi | PM | Cytosol | Nucleus | |||||
| Expt A |
5 peptides |
9 spectra |
|
0.000 0.000 | 0.000 |
0.113 0.100 | 0.124 |
0.000 0.000 | 0.000 |
0.000 0.000 | 0.000 |
0.000 0.000 | 0.000 |
0.000 0.000 | 0.000 |
0.887 0.873 | 0.898 |
0.000 0.000 | 0.000 |
| 1 spectrum, YVQQTYR | 0.000 | 0.027 | 0.000 | 0.000 | 0.000 | 0.000 | 0.973 | 0.000 | ||
| 4 spectra, EGIEYR | 0.000 | 0.071 | 0.000 | 0.000 | 0.000 | 0.000 | 0.929 | 0.000 | ||
| 2 spectra, DIVSGLK | 0.000 | 0.121 | 0.000 | 0.000 | 0.093 | 0.000 | 0.787 | 0.000 | ||
| 1 spectrum, DTFVLK | 0.000 | 0.195 | 0.000 | 0.000 | 0.000 | 0.013 | 0.793 | 0.000 | ||
| 1 spectrum, GTYHNK | 0.000 | 0.093 | 0.000 | 0.000 | 0.000 | 0.000 | 0.907 | 0.000 |
| Plot | Lyso | Other | |||||||||||
| Expt C |
6 peptides |
27 spectra |
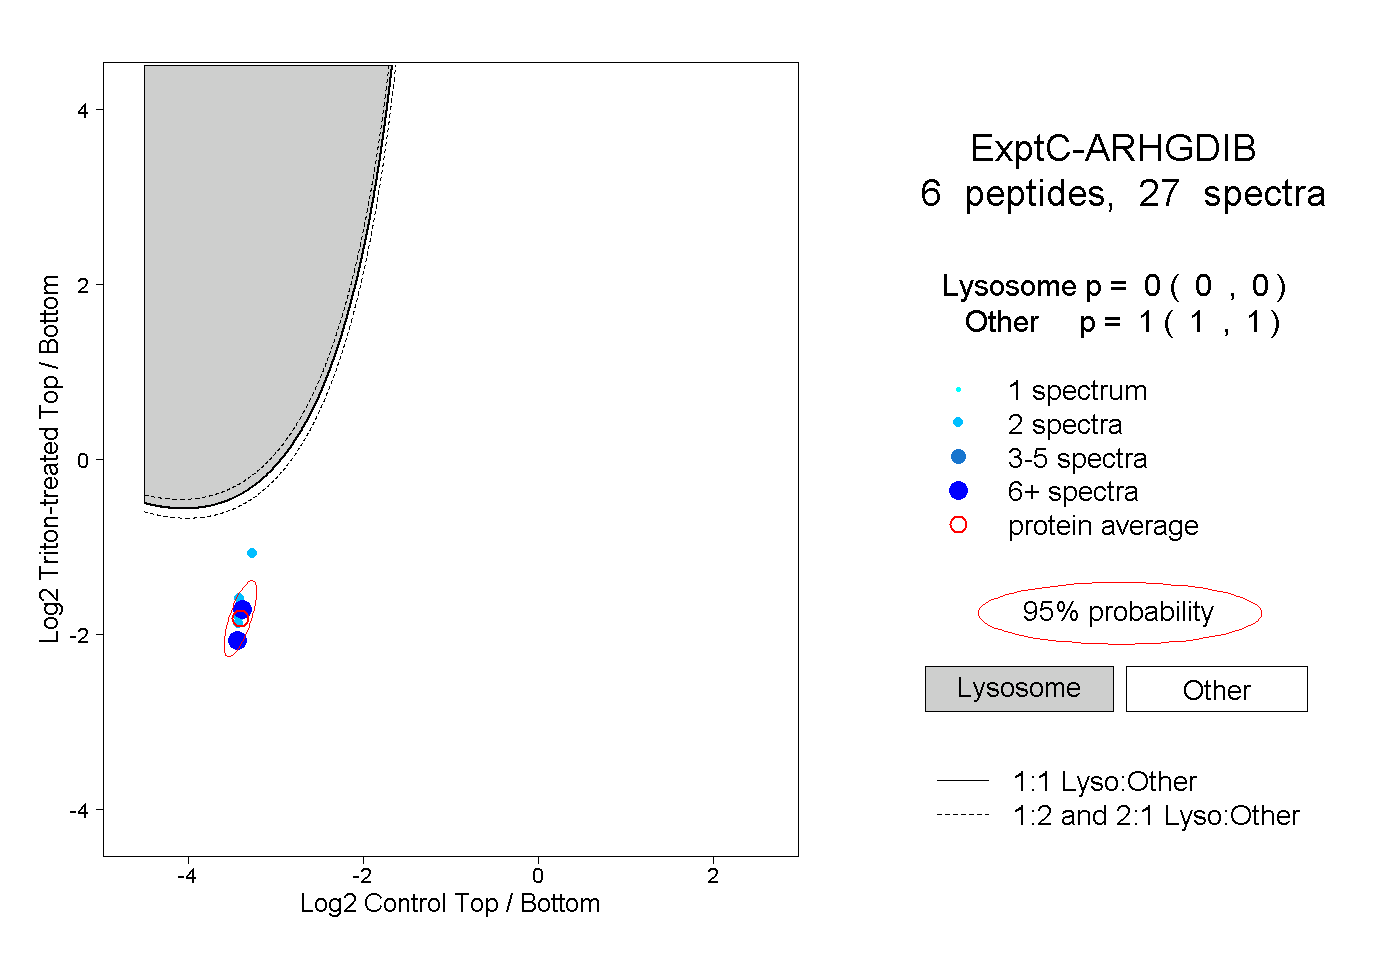 |
0.000 0.000 | 0.000 |
1.000 1.000 | 1.000 |