 5
5peptides
spectra
0.000 | 0.000
0.100 | 0.124
0.000 | 0.000
0.000 | 0.000
0.000 | 0.000
0.000 | 0.000
0.873 | 0.898
0.000 | 0.000
6peptides
spectra
0.000 | 0.000
1.000 | 1.000
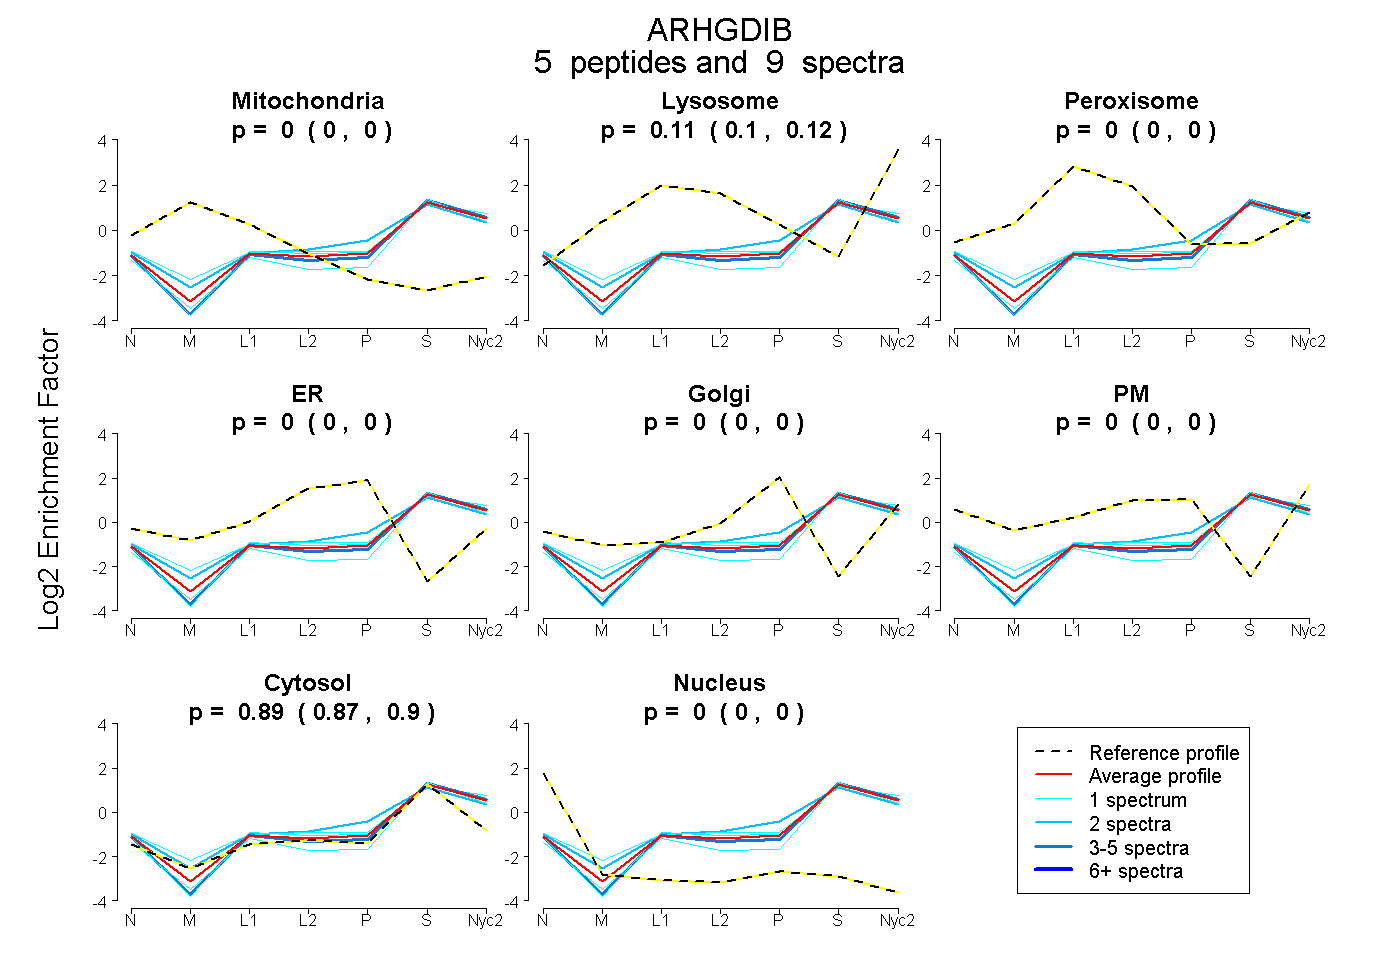
| Plot | Mito | Lyso | Perox | ER | Golgi | PM | Cytosol | Nucleus | |||||
| Expt A |
5 peptides |
9 spectra |
|
0.000 0.000 | 0.000 |
0.113 0.100 | 0.124 |
0.000 0.000 | 0.000 |
0.000 0.000 | 0.000 |
0.000 0.000 | 0.000 |
0.000 0.000 | 0.000 |
0.887 0.873 | 0.898 |
0.000 0.000 | 0.000 |
||
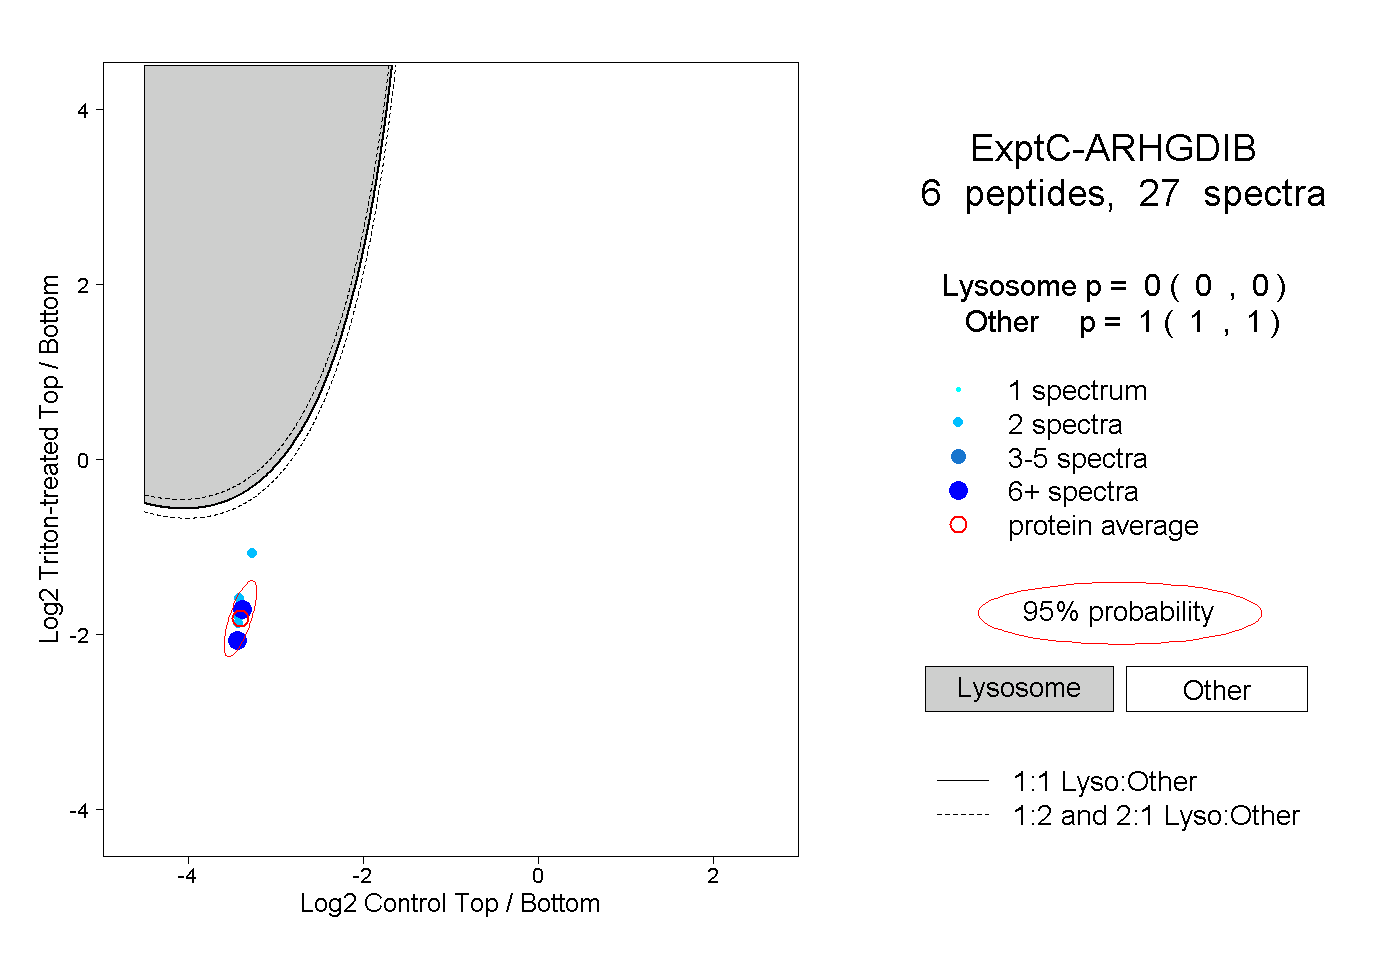
| Plot | Lyso | Other | |||||||||||
| Expt C |
6 peptides |
27 spectra |
|
0.000 0.000 | 0.000 |
1.000 1.000 | 1.000 |