 7
7peptides
spectra
0.000 | 0.000
0.000 | 0.000
0.000 | 0.000
0.000 | 0.000
0.062 | 0.105
0.000 | 0.000
0.890 | 0.934
0.000 | 0.000
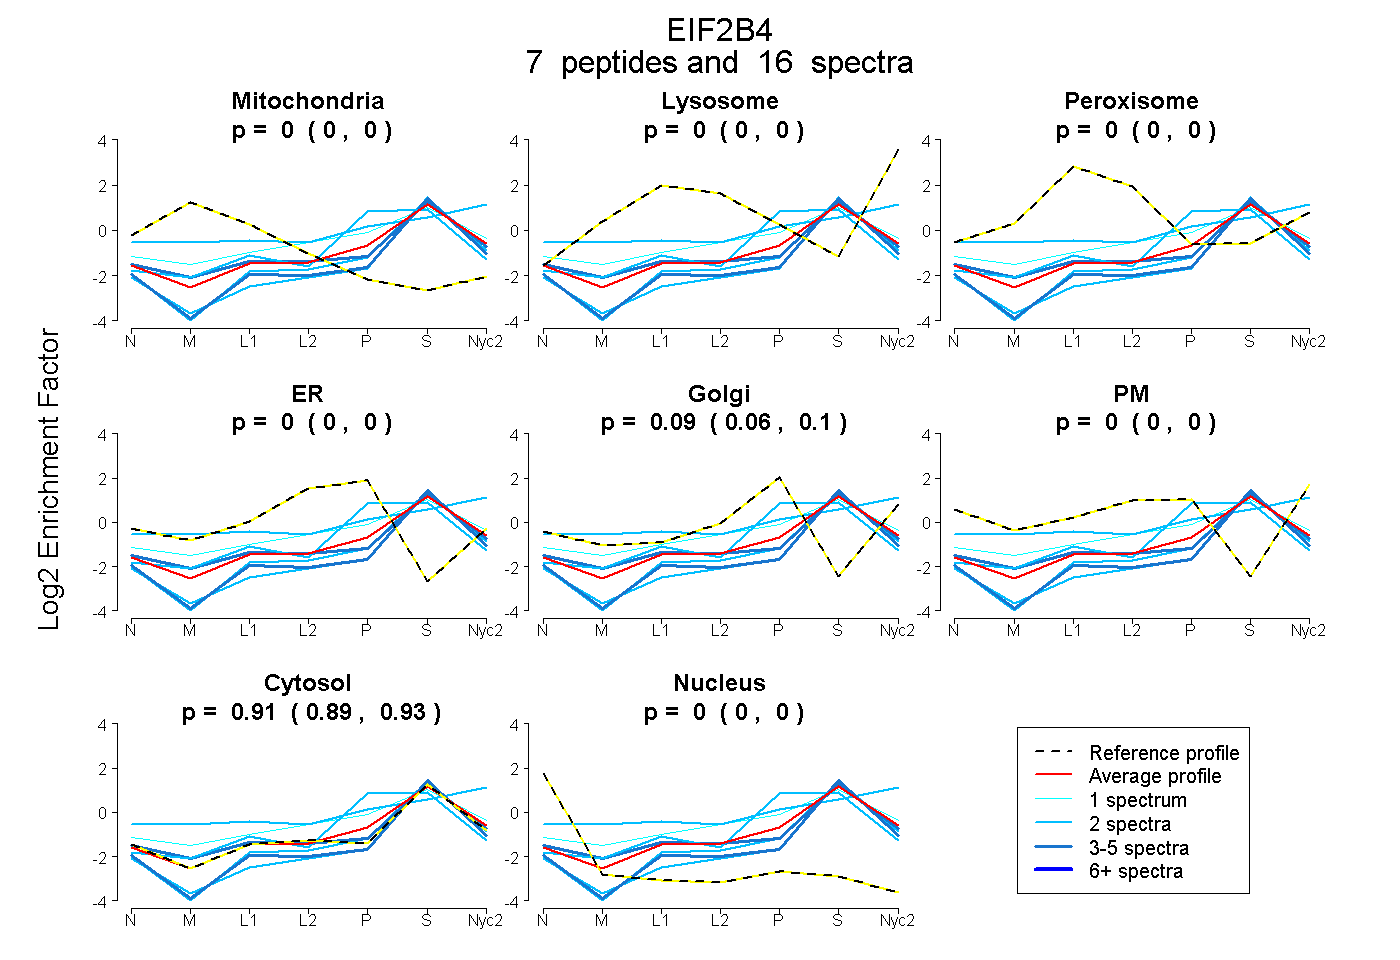
| Plot | Mito | Lyso | Perox | ER | Golgi | PM | Cytosol | Nucleus | |||||
| Expt A |
7 peptides |
16 spectra |
|
0.000 0.000 | 0.000 |
0.000 0.000 | 0.000 |
0.000 0.000 | 0.000 |
0.000 0.000 | 0.000 |
0.086 0.062 | 0.105 |
0.000 0.000 | 0.000 |
0.914 0.890 | 0.934 |
0.000 0.000 | 0.000 |
| 4 spectra, VGTAQLALVAR | 0.023 | 0.028 | 0.000 | 0.000 | 0.003 | 0.000 | 0.945 | 0.000 | ||
| 3 spectra, QQVPTR | 0.000 | 0.000 | 0.000 | 0.000 | 0.000 | 0.000 | 0.975 | 0.025 | ||
| 2 spectra, IVLASQAISR | 0.000 | 0.000 | 0.000 | 0.000 | 0.000 | 0.000 | 0.960 | 0.040 | ||
| 2 spectra, VSLFSHLPQYSR | 0.000 | 0.000 | 0.000 | 0.000 | 0.252 | 0.000 | 0.748 | 0.000 | ||
| 2 spectra, LGLQYSQGLVSGSNAR | 0.000 | 0.267 | 0.000 | 0.000 | 0.061 | 0.169 | 0.504 | 0.000 | ||
| 1 spectrum, AHNVPVLVCCETYK | 0.000 | 0.023 | 0.098 | 0.009 | 0.173 | 0.000 | 0.697 | 0.000 | ||
| 2 spectra, ELTQEEK | 0.000 | 0.000 | 0.000 | 0.000 | 0.000 | 0.000 | 1.000 | 0.000 |
| Plot | Mito | Lyso or Perox | ER | Golgi | PM | Cytosol | Nucleus | ||||||
| Expt B |
3 peptides |
6 spectra |
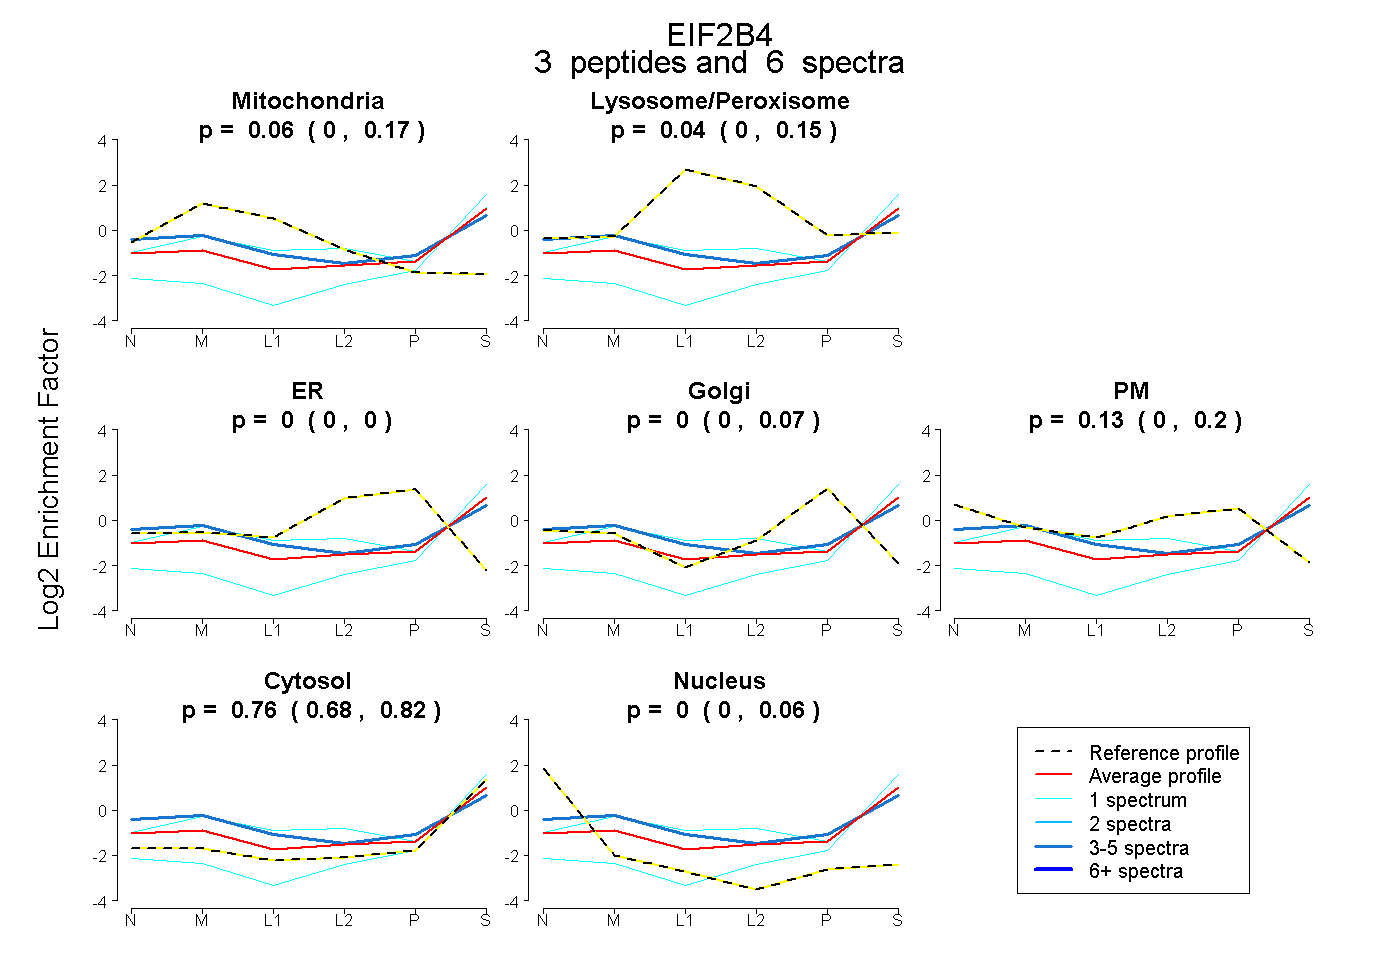 |
0.065 0.000 | 0.168 |
0.042 0.000 | 0.148 |
0.000 0.000 | 0.000 |
0.000 0.000 | 0.066 |
0.129 0.000 | 0.198 |
0.764 0.680 | 0.820 |
0.000 0.000 | 0.057 |
|||
| Plot | Lyso | Other | |||||||||||
| Expt C |
5 peptides |
8 spectra |
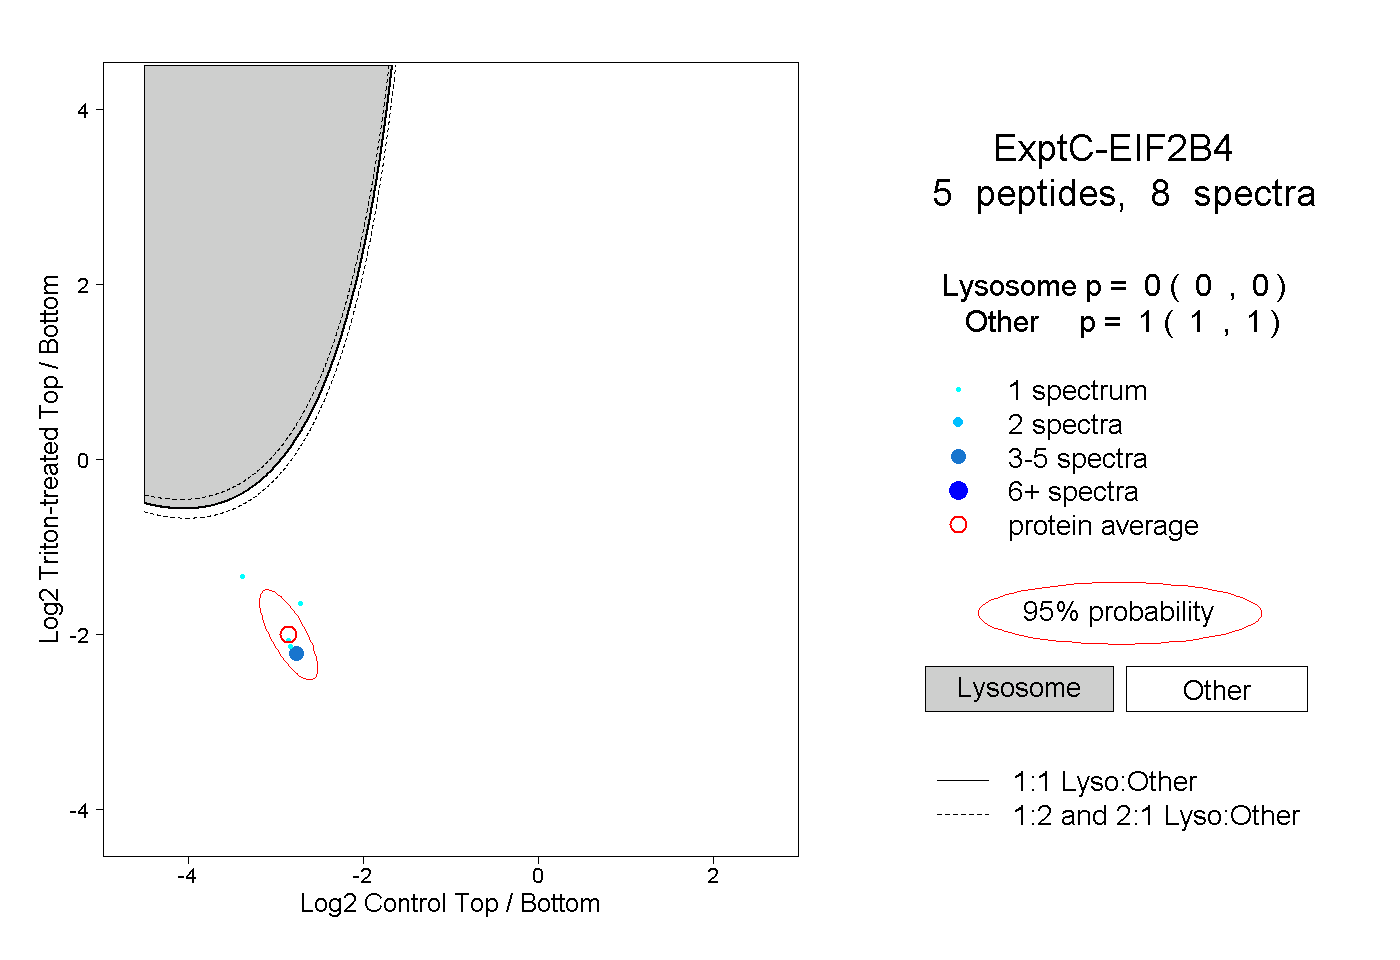 |
0.000 0.000 | 0.000 |
1.000 1.000 | 1.000 |