 3
3peptides
spectra
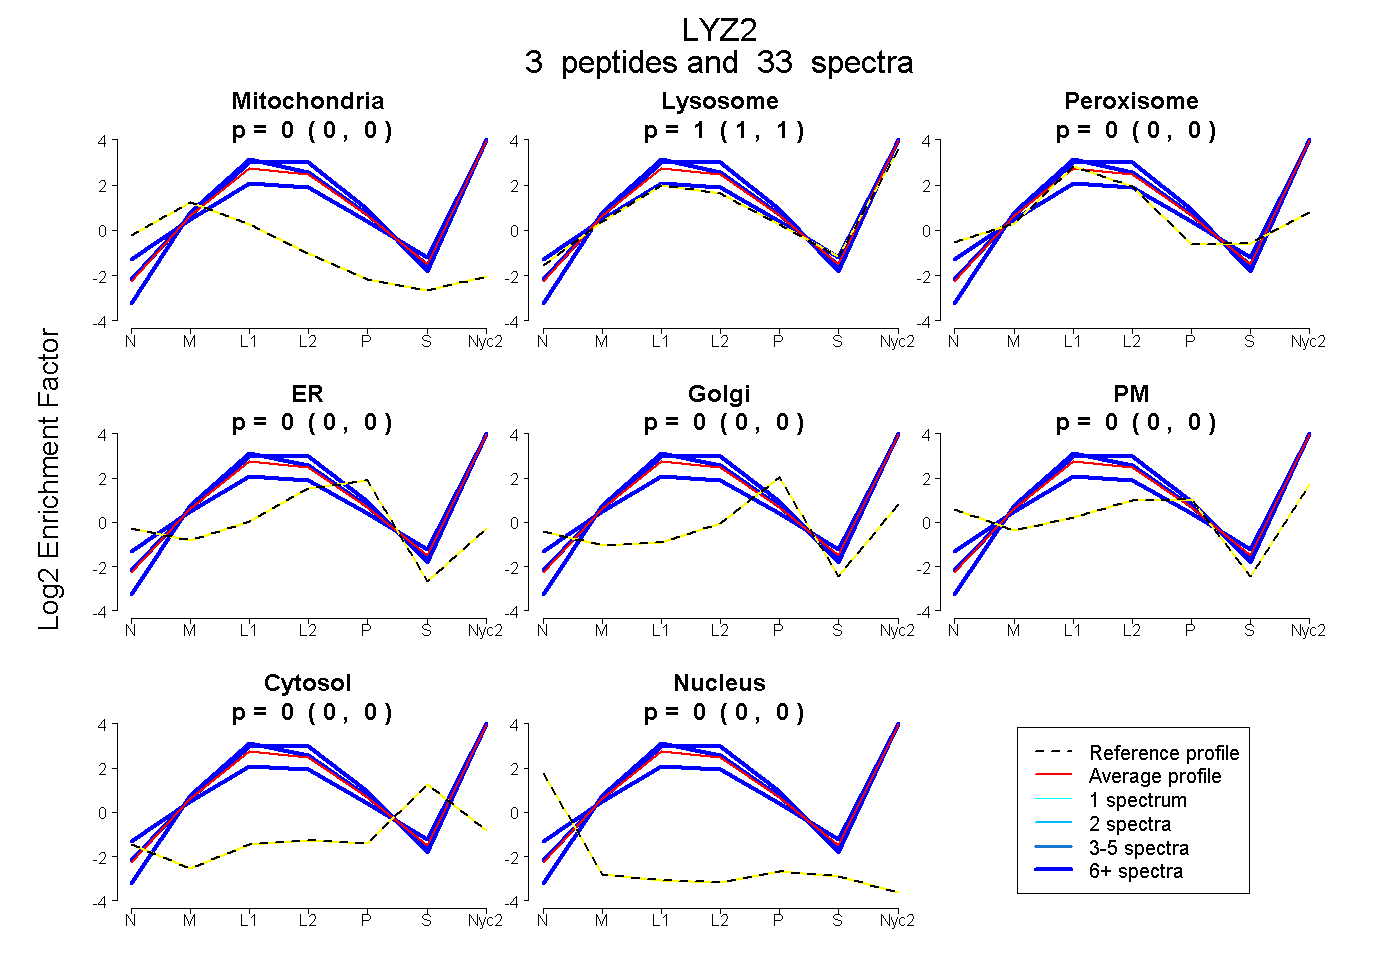
0.000 | 0.000
1.000 | 1.000
0.000 | 0.000
0.000 | 0.000
0.000 | 0.000
0.000 | 0.000
0.000 | 0.000
0.000 | 0.000
4peptides
spectra
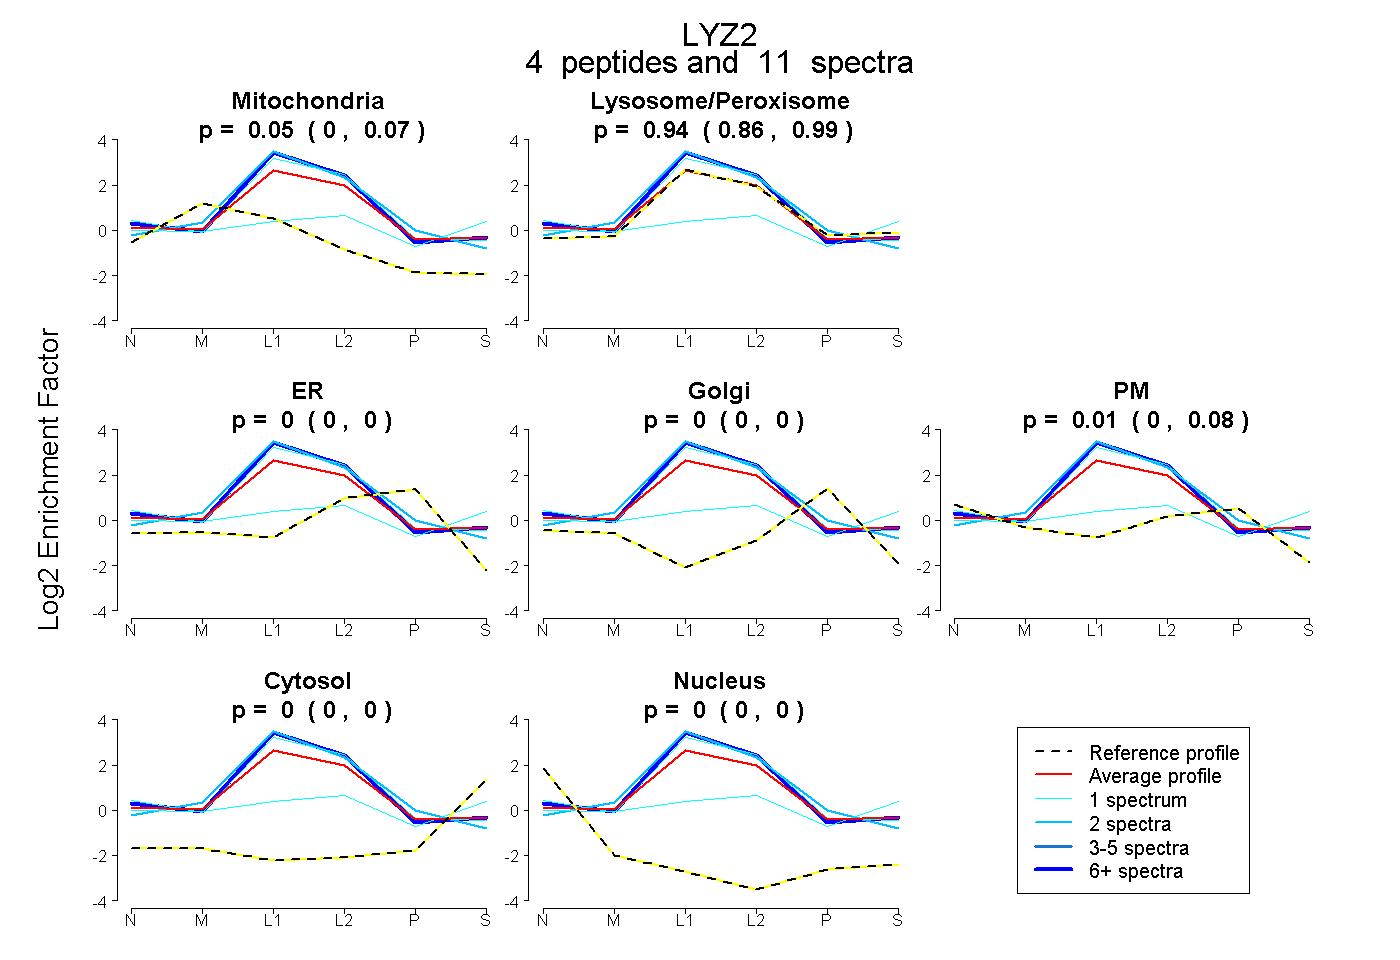
0.000 | 0.075
0.863 | 0.995
0.000 | 0.000
0.000 | 0.000
0.000 | 0.082
0.000 | 0.000
0.000 | 0.000
5peptides
spectra
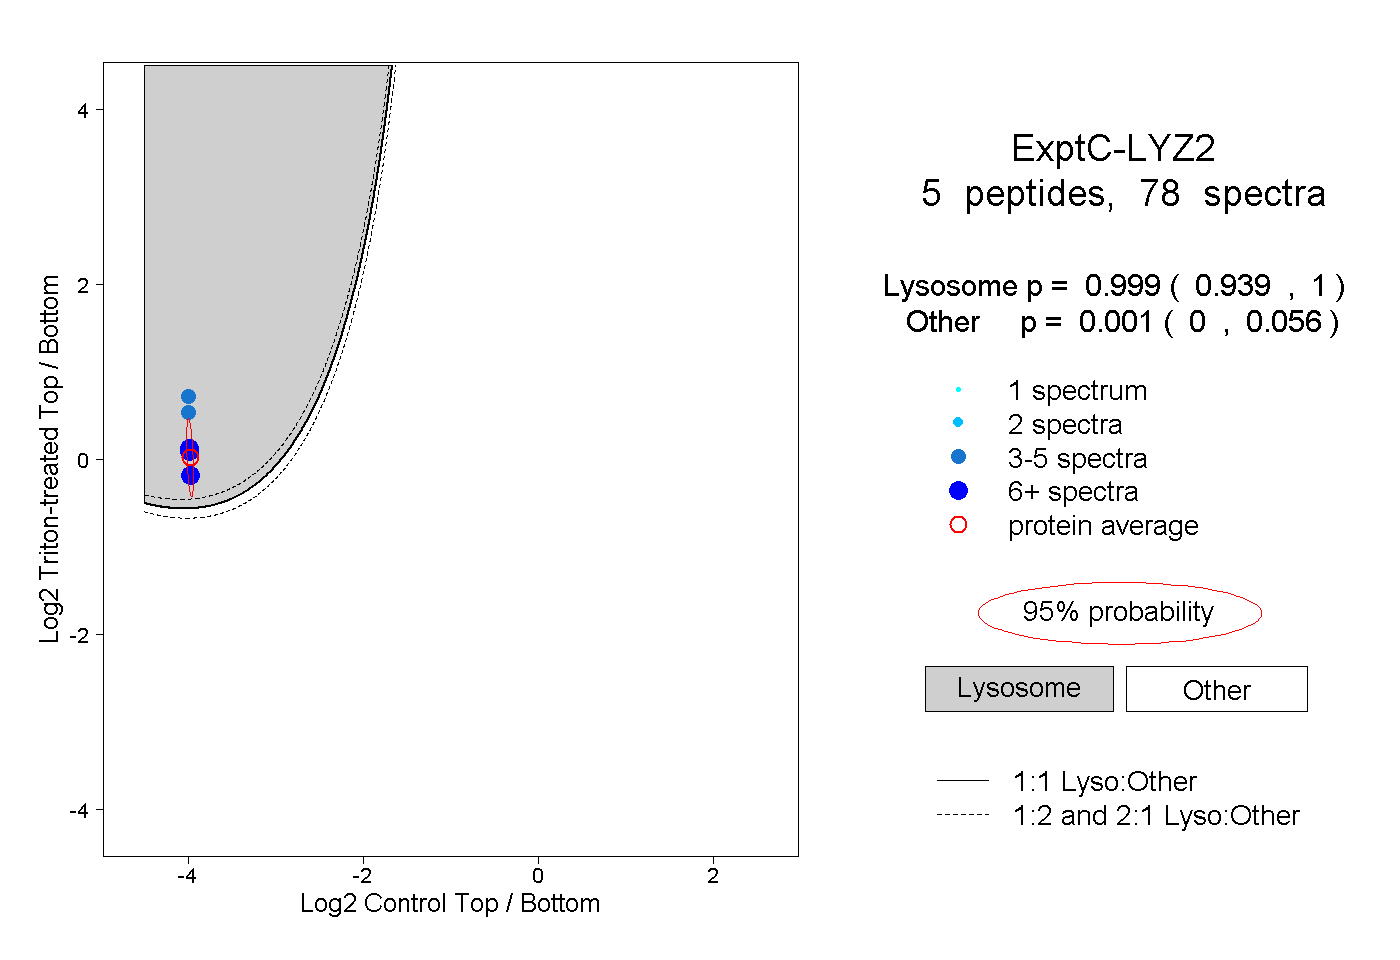
0.939 | 1.000
0.000 | 0.056
1peptide
spectra
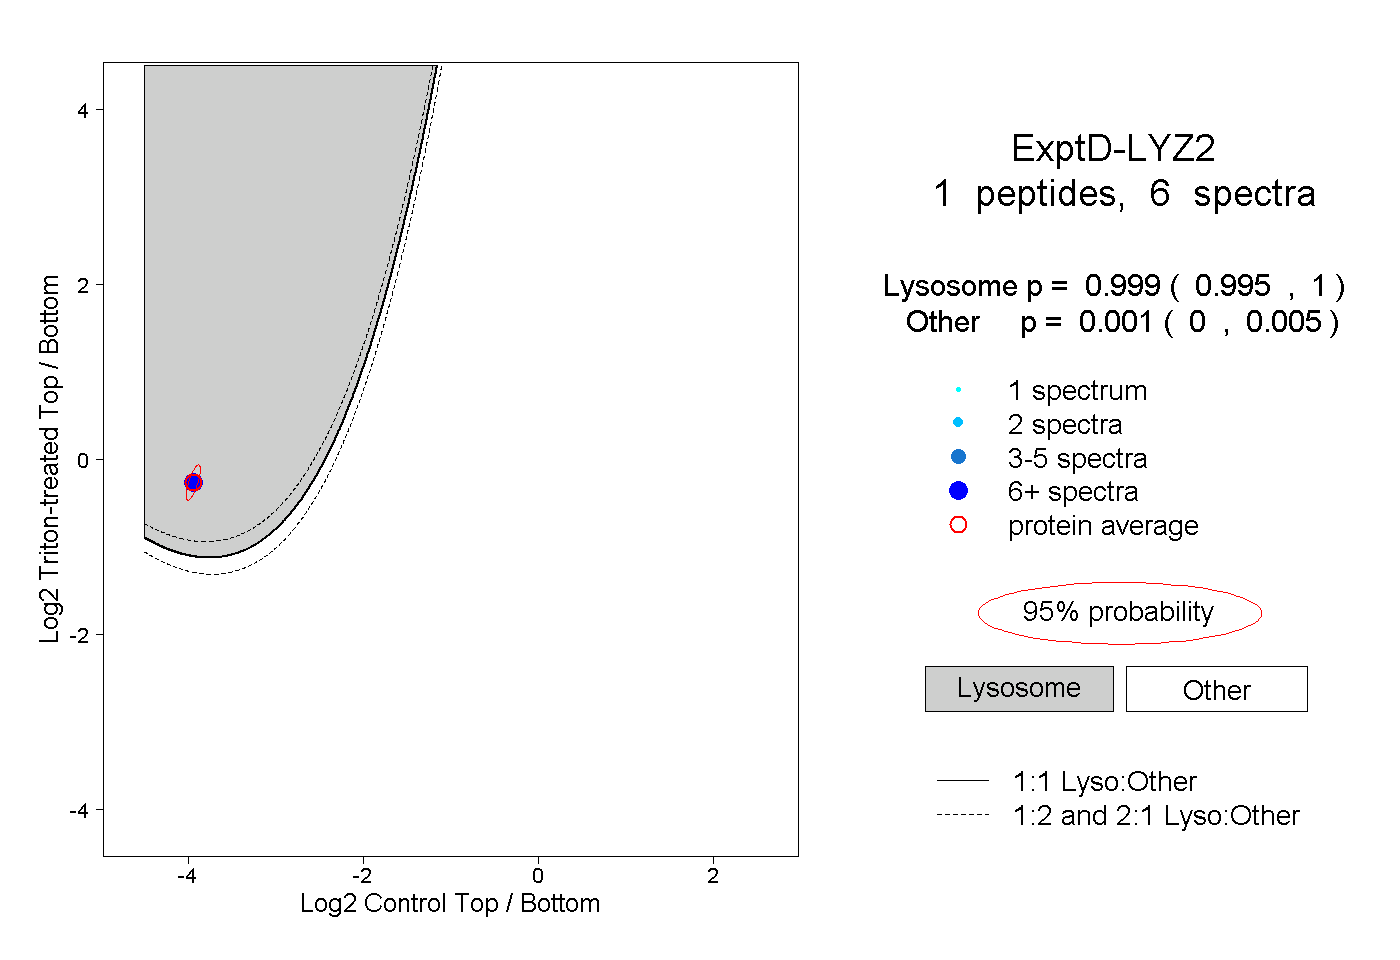
0.995 | 1.000
0.000 | 0.005