 3
3peptides
spectra
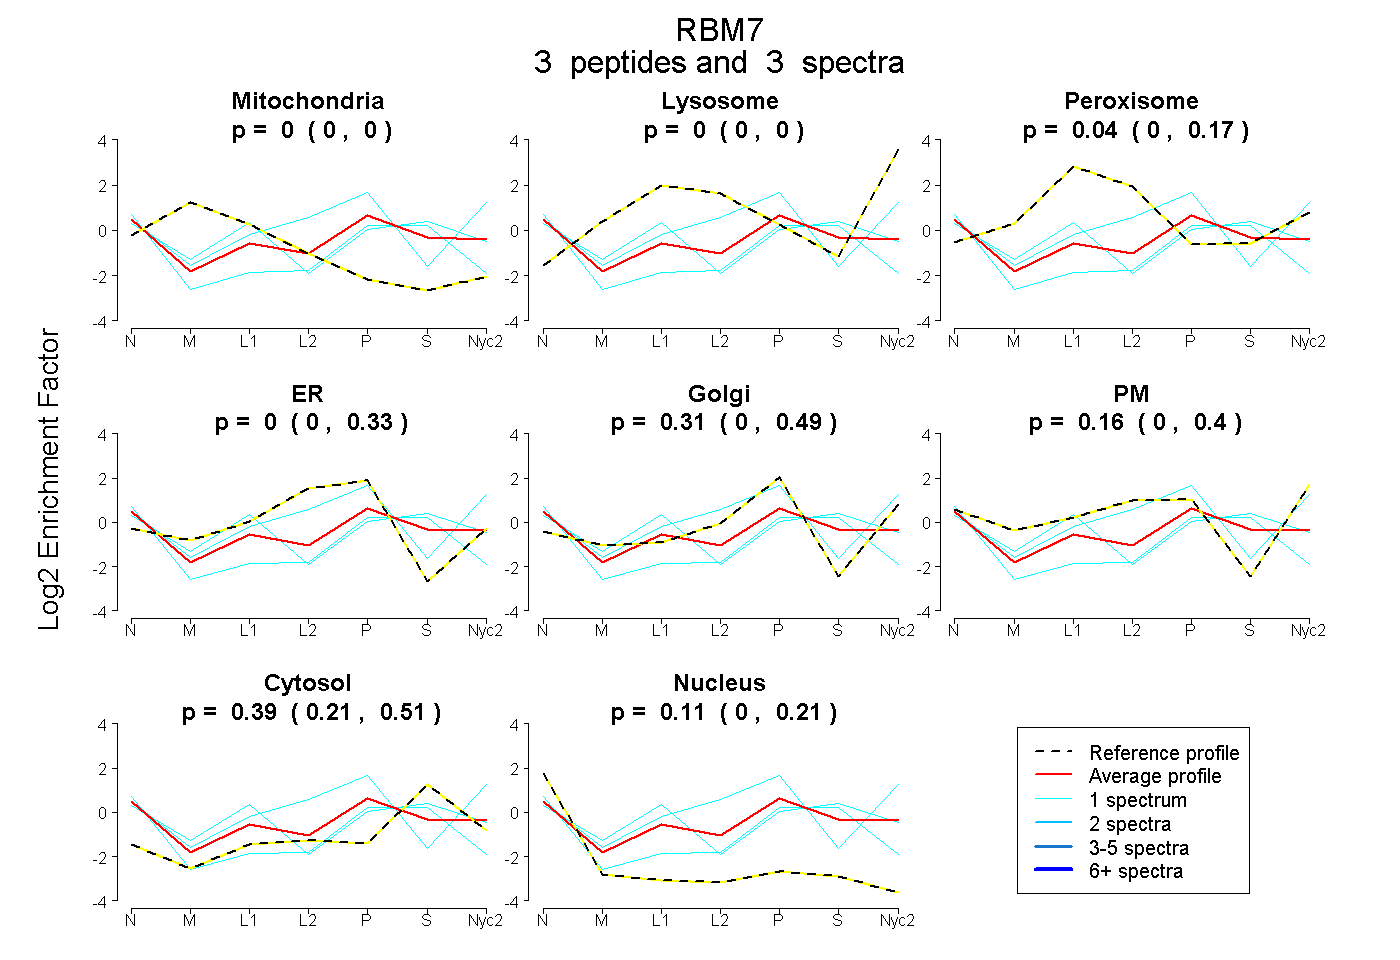
0.000 | 0.000
0.000 | 0.000
0.000 | 0.172
0.000 | 0.331
0.000 | 0.493
0.000 | 0.397
0.208 | 0.509
0.000 | 0.213
| Plot | Mito | Lyso | Perox | ER | Golgi | PM | Cytosol | Nucleus | |||||
| Expt A |
3 peptides |
3 spectra |
|
0.000 0.000 | 0.000 |
0.000 0.000 | 0.000 |
0.037 0.000 | 0.172 |
0.000 0.000 | 0.331 |
0.312 0.000 | 0.493 |
0.156 0.000 | 0.397 |
0.386 0.208 | 0.509 |
0.107 0.000 | 0.213 |
| 1 spectrum, SFSTPEDYQR | 0.000 | 0.000 | 0.000 | 0.000 | 0.209 | 0.000 | 0.500 | 0.290 | ||
| 1 spectrum, EDFYYDDR | 0.000 | 0.000 | 0.252 | 0.000 | 0.178 | 0.000 | 0.446 | 0.125 | ||
| 1 spectrum, NLLNGIK | 0.000 | 0.000 | 0.000 | 0.025 | 0.357 | 0.517 | 0.101 | 0.000 |
| Plot | Lyso | Other | |||||||||||
| Expt C |
1 peptide |
4 spectra |
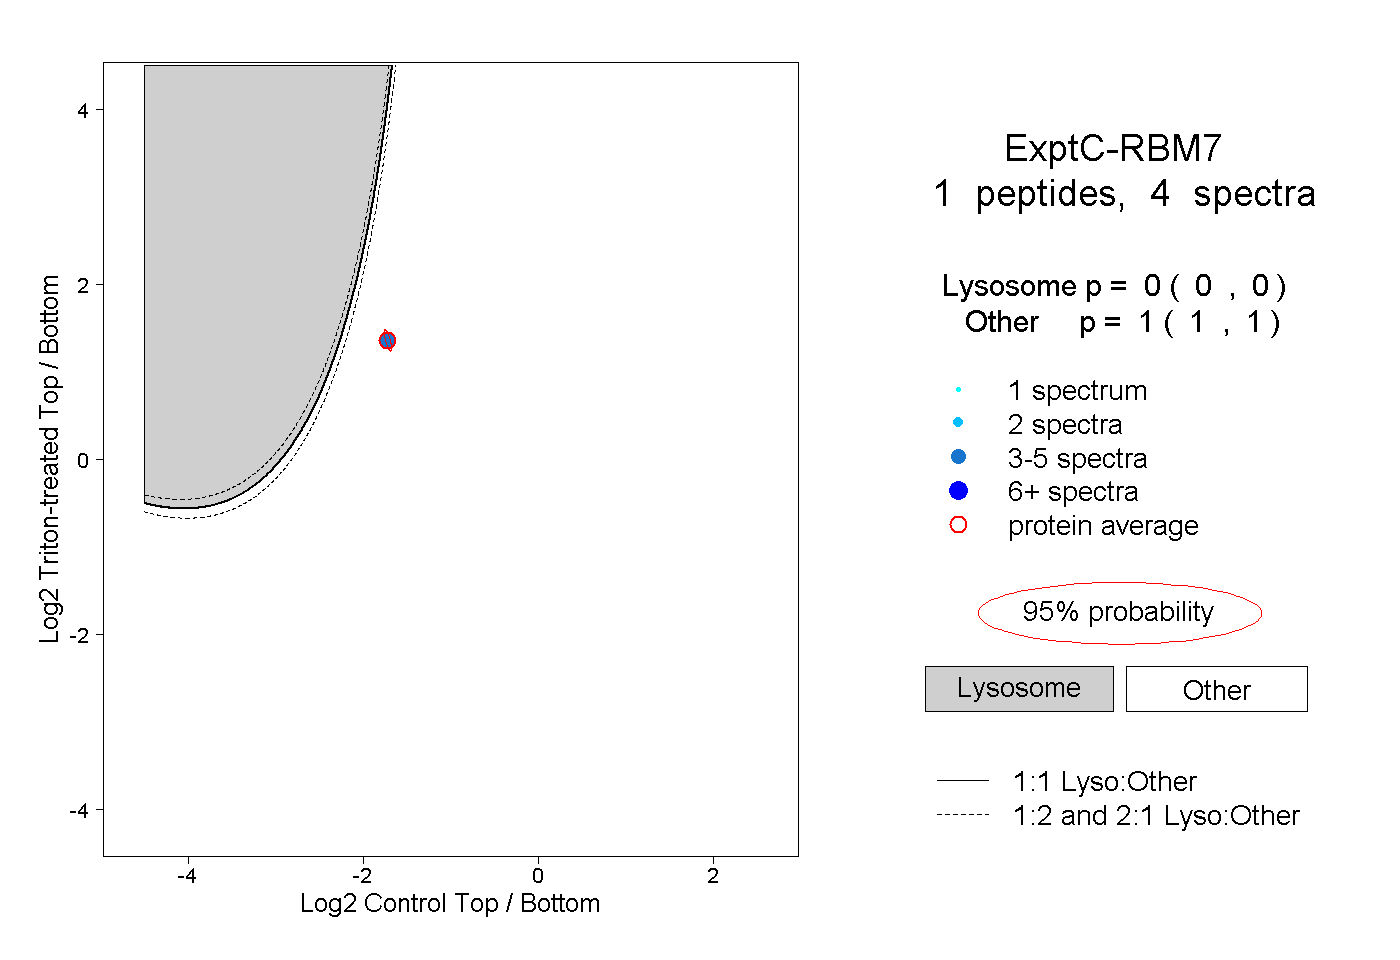 |
0.000 0.000 | 0.000 |
1.000 1.000 | 1.000 |