| 4 spectra, NIIGYFEQK |
0.000 |
|
0.000 |
|
1.000 |
0.000 |
0.000 |
0.000 |
0.000 |
|
| 1 spectrum, VASILHDDCAFLSAFGDLSKPER |
0.000 |
|
0.000 |
|
1.000 |
0.000 |
0.000 |
0.000 |
0.000 |
|
| 10 spectra, LAPSEYR |
0.000 |
|
0.056 |
|
0.806 |
0.041 |
0.000 |
0.098 |
0.000 |
|
| 7 spectra, SNPVHEIQSLDEVTNLDR |
0.000 |
|
0.270 |
|
0.475 |
0.175 |
0.000 |
0.081 |
0.000 |
|
| 8 spectra, AIADYLR |
0.000 |
|
0.055 |
|
0.909 |
0.000 |
0.035 |
0.000 |
0.000 |
|
| 4 spectra, QFVFDLHSGK |
0.000 |
|
0.128 |
|
0.802 |
0.053 |
0.000 |
0.017 |
0.000 |
|
| 4 spectra, YSGDNLIYKPPGR |
0.016 |
|
0.035 |
|
0.850 |
0.000 |
0.098 |
0.000 |
0.000 |
|
| 5 spectra, CVPLVR |
0.054 |
|
0.074 |
|
0.786 |
0.000 |
0.087 |
0.000 |
0.000 |
|
| 11 spectra, HPLLHIQK |
0.000 |
|
0.000 |
|
1.000 |
0.000 |
0.000 |
0.000 |
0.000 |
|
| 1 spectrum, EDTESLEIFQNEVAR |
0.000 |
|
0.171 |
|
0.746 |
0.000 |
0.000 |
0.083 |
0.000 |
|
| 9 spectra, VDCDQHSDIAQR |
0.000 |
|
0.000 |
|
0.940 |
0.000 |
0.060 |
0.000 |
0.000 |
|
| 2 spectra, NQVVFAR |
0.000 |
|
0.026 |
|
0.974 |
0.000 |
0.000 |
0.000 |
0.000 |
|
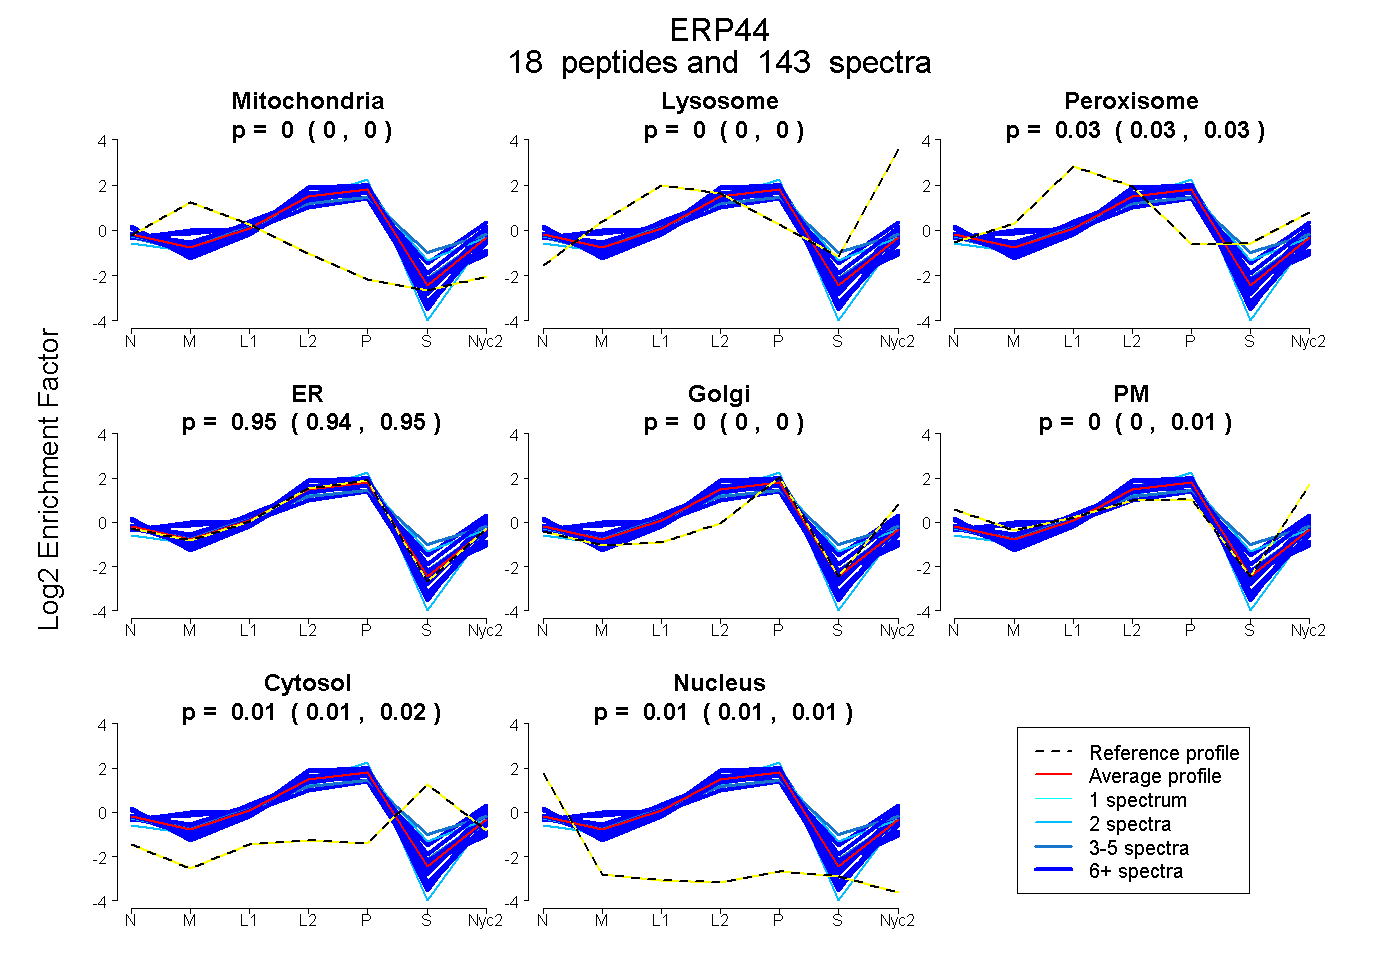
 18
18