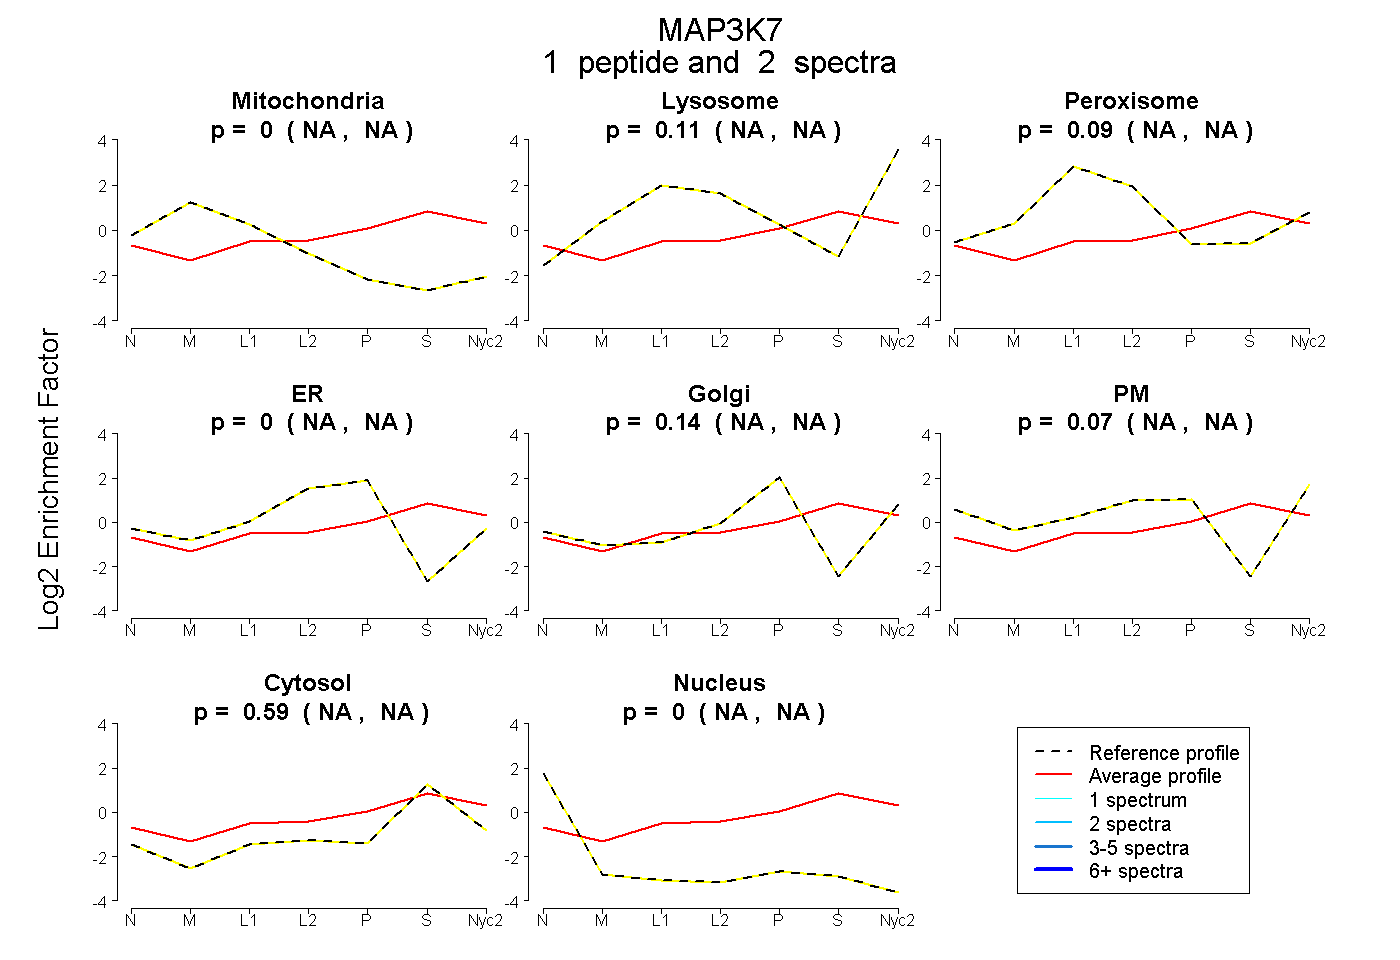
 1
1peptide
spectra
NA | NA
NA | NA
NA | NA
NA | NA
NA | NA
NA | NA
NA | NA
NA | NA
| Plot | Mito | Lyso | Perox | ER | Golgi | PM | Cytosol | Nucleus | |||||
| Expt A |
1 peptide |
2 spectra |
|
0.000 NA | NA |
0.111 NA | NA |
0.092 NA | NA |
0.000 NA | NA |
0.137 NA | NA |
0.066 NA | NA |
0.594 NA | NA |
0.000 NA | NA |
| 2 spectra, IMTHLMR | 0.000 | 0.111 | 0.092 | 0.000 | 0.137 | 0.066 | 0.594 | 0.000 |
| Plot | Lyso | Other | |||||||||||
| Expt C |
2 peptides |
6 spectra |
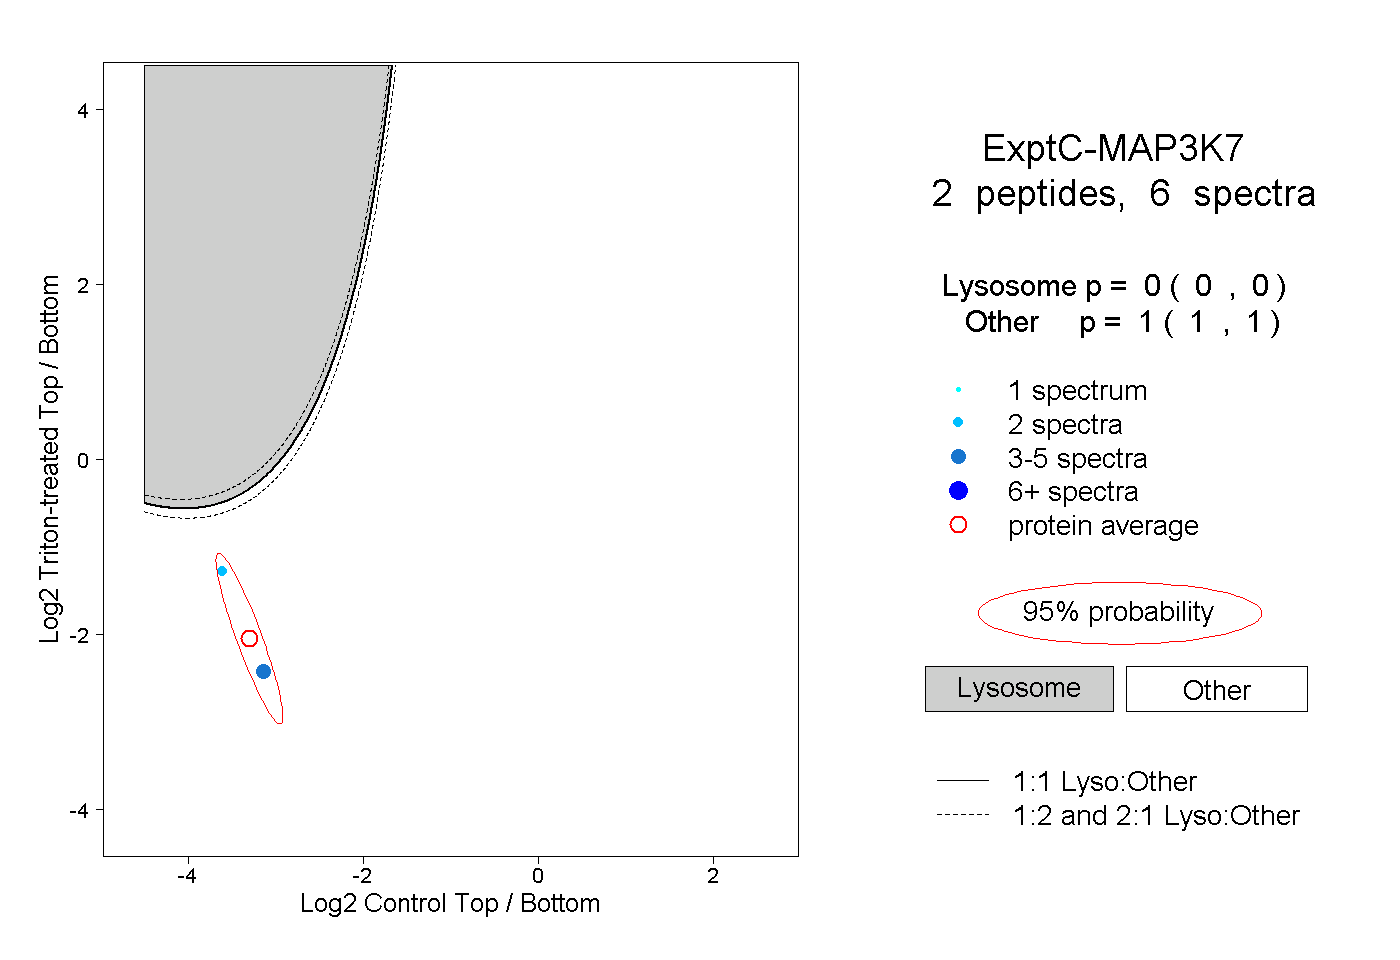 |
0.000 0.000 | 0.000 |
1.000 1.000 | 1.000 |