 7
7peptides
spectra
0.000 | 0.000
0.397 | 0.569
0.123 | 0.264
0.000 | 0.000
0.000 | 0.000
0.280 | 0.328
0.000 | 0.000
0.000 | 0.000
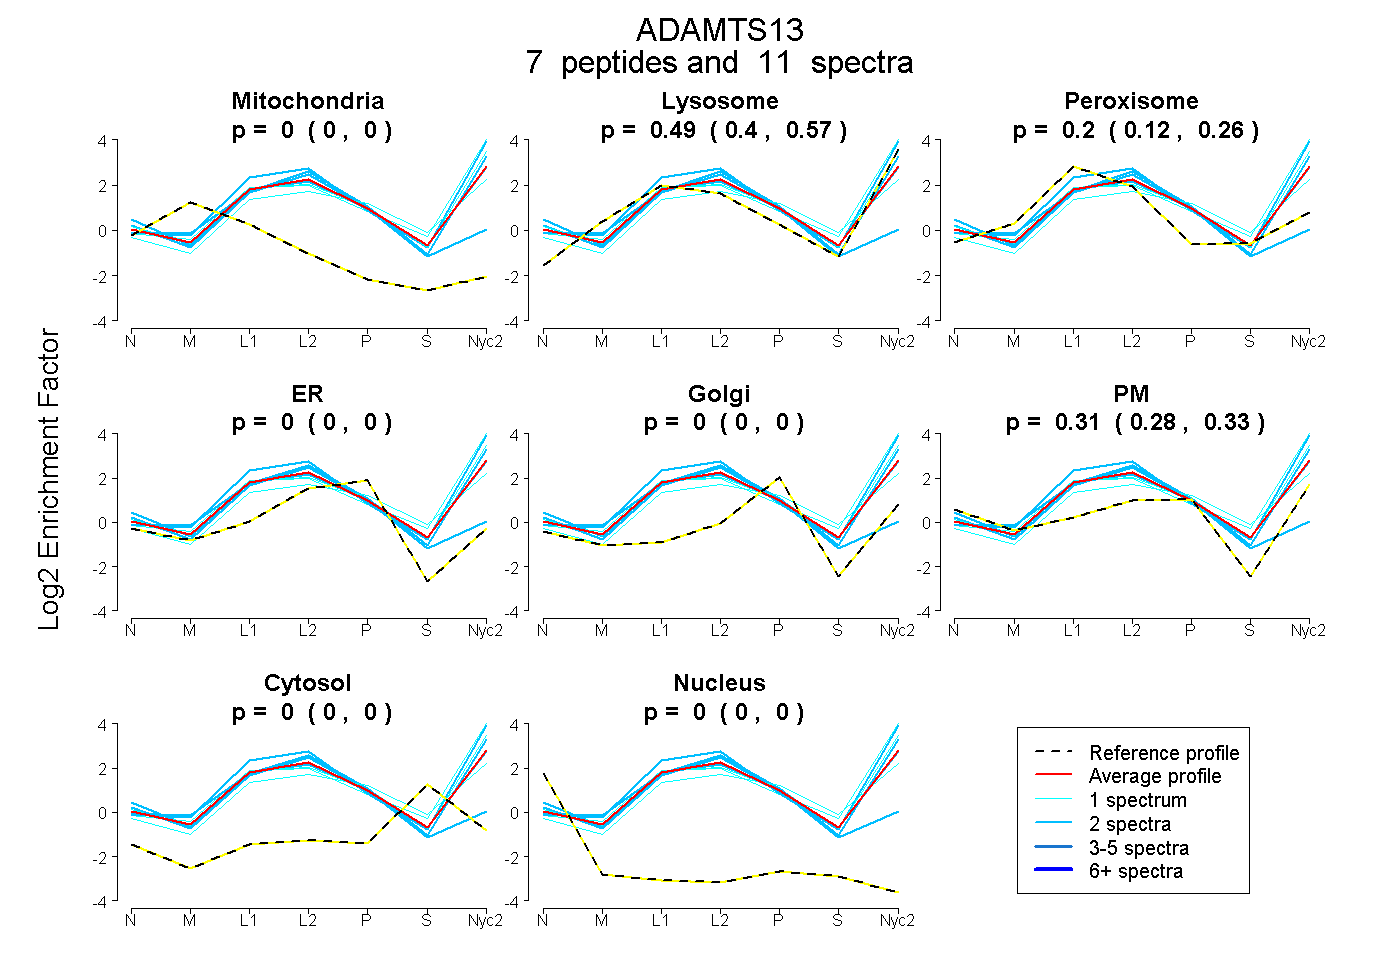
| Plot | Mito | Lyso | Perox | ER | Golgi | PM | Cytosol | Nucleus | |||||
| Expt A |
7 peptides |
11 spectra |
|
0.000 0.000 | 0.000 |
0.491 0.397 | 0.569 |
0.200 0.123 | 0.264 |
0.000 0.000 | 0.000 |
0.000 0.000 | 0.000 |
0.308 0.280 | 0.328 |
0.000 0.000 | 0.000 |
0.000 0.000 | 0.000 |
| 2 spectra, QLFGPR | 0.000 | 0.873 | 0.037 | 0.000 | 0.000 | 0.090 | 0.000 | 0.000 | ||
| 1 spectrum, VTLTEDQLPR | 0.000 | 0.481 | 0.124 | 0.128 | 0.000 | 0.147 | 0.119 | 0.000 | ||
| 1 spectrum, SQPAPGTFYK | 0.000 | 0.667 | 0.031 | 0.000 | 0.000 | 0.302 | 0.000 | 0.000 | ||
| 2 spectra, VFVSVAPQAR | 0.000 | 0.662 | 0.049 | 0.000 | 0.000 | 0.288 | 0.000 | 0.000 | ||
| 1 spectrum, ANTVVVR | 0.000 | 0.863 | 0.000 | 0.000 | 0.000 | 0.137 | 0.000 | 0.000 | ||
| 2 spectra, ALVRPPASVPCLIADCAYR | 0.000 | 0.000 | 0.521 | 0.479 | 0.000 | 0.000 | 0.000 | 0.000 | ||
| 2 spectra, LEEIHIR | 0.000 | 0.433 | 0.213 | 0.000 | 0.000 | 0.354 | 0.000 | 0.000 |
| Plot | Mito | Lyso or Perox | ER | Golgi | PM | Cytosol | Nucleus | ||||||
| Expt B |
2 peptides |
4 spectra |
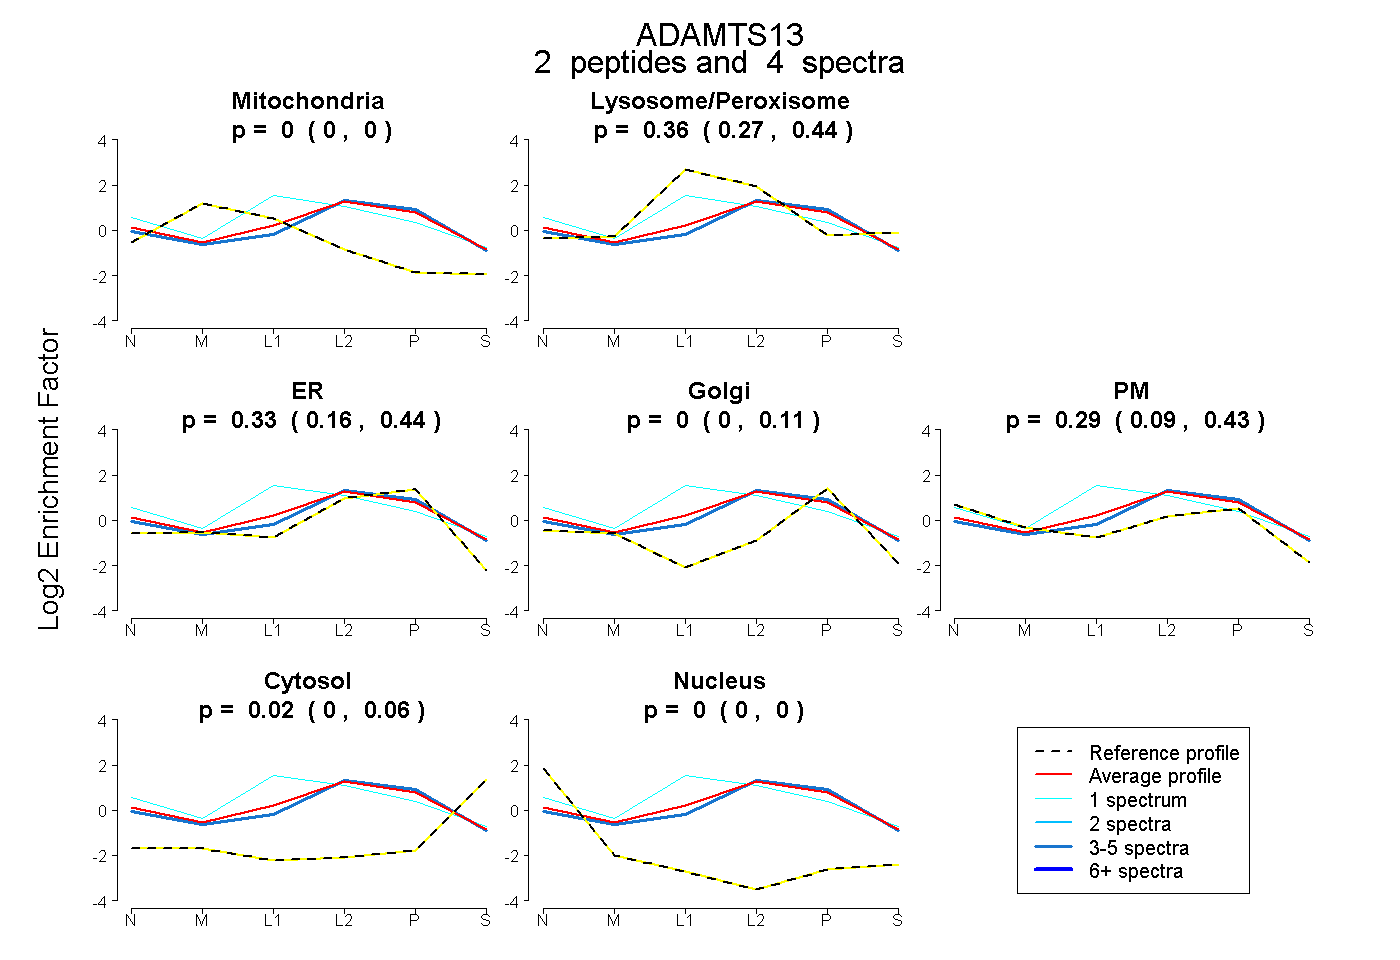 |
0.000 0.000 | 0.000 |
0.356 0.273 | 0.444 |
0.334 0.164 | 0.439 |
0.000 0.000 | 0.107 |
0.286 0.085 | 0.427 |
0.024 0.000 | 0.062 |
0.000 0.000 | 0.000 |
|||
| Plot | Lyso | Other | |||||||||||
| Expt C |
10 peptides |
26 spectra |
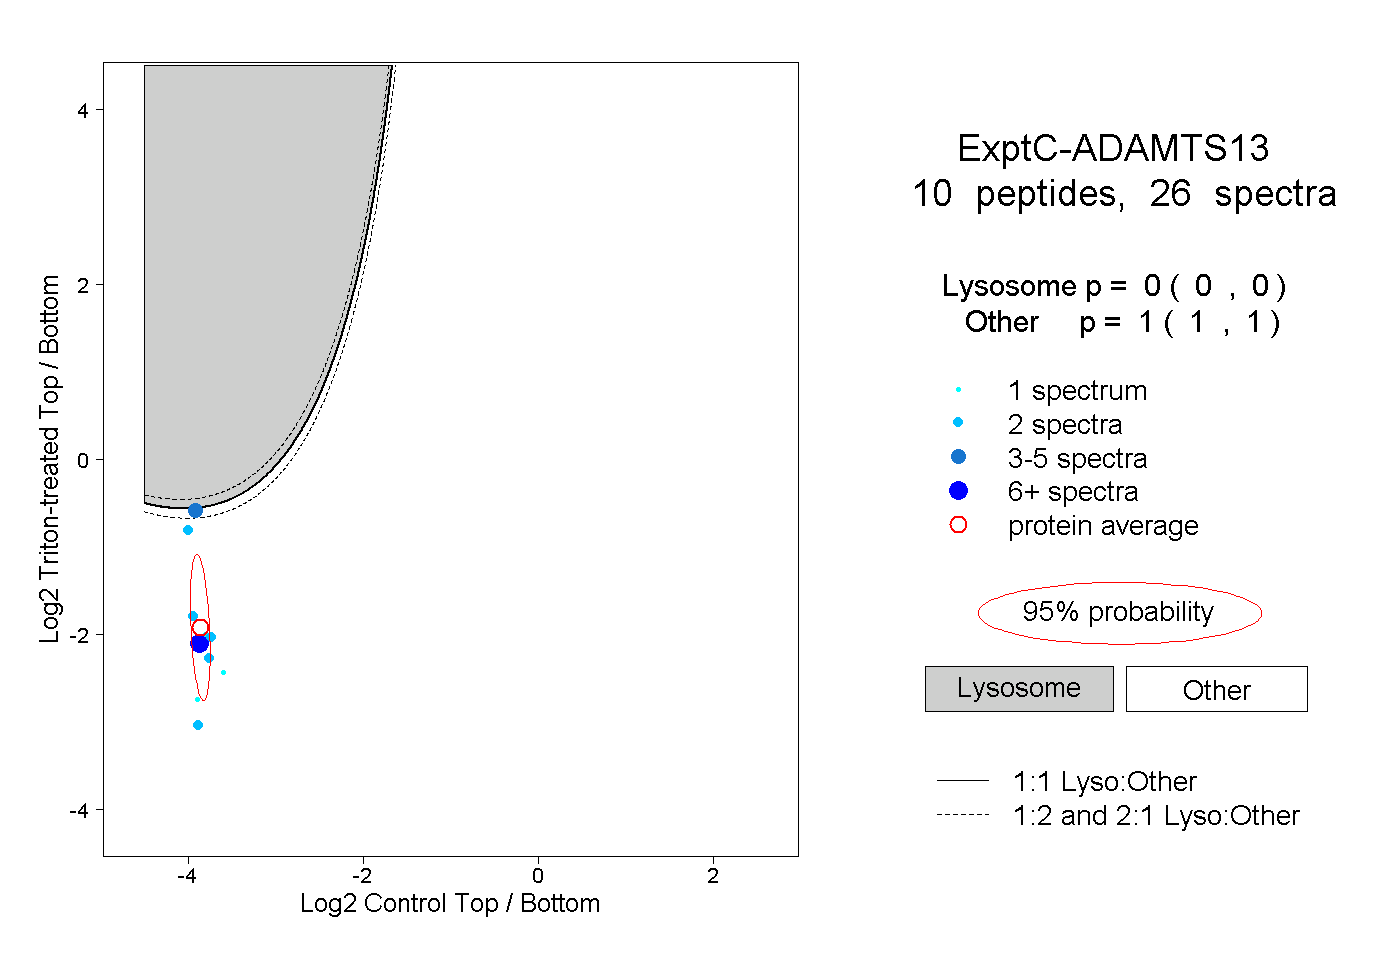 |
0.000 0.000 | 0.000 |
1.000 1.000 | 1.000 |
||||||||
| Plot | Lyso | Other | |||||||||||
| Expt D |
2 peptides |
5 spectra |
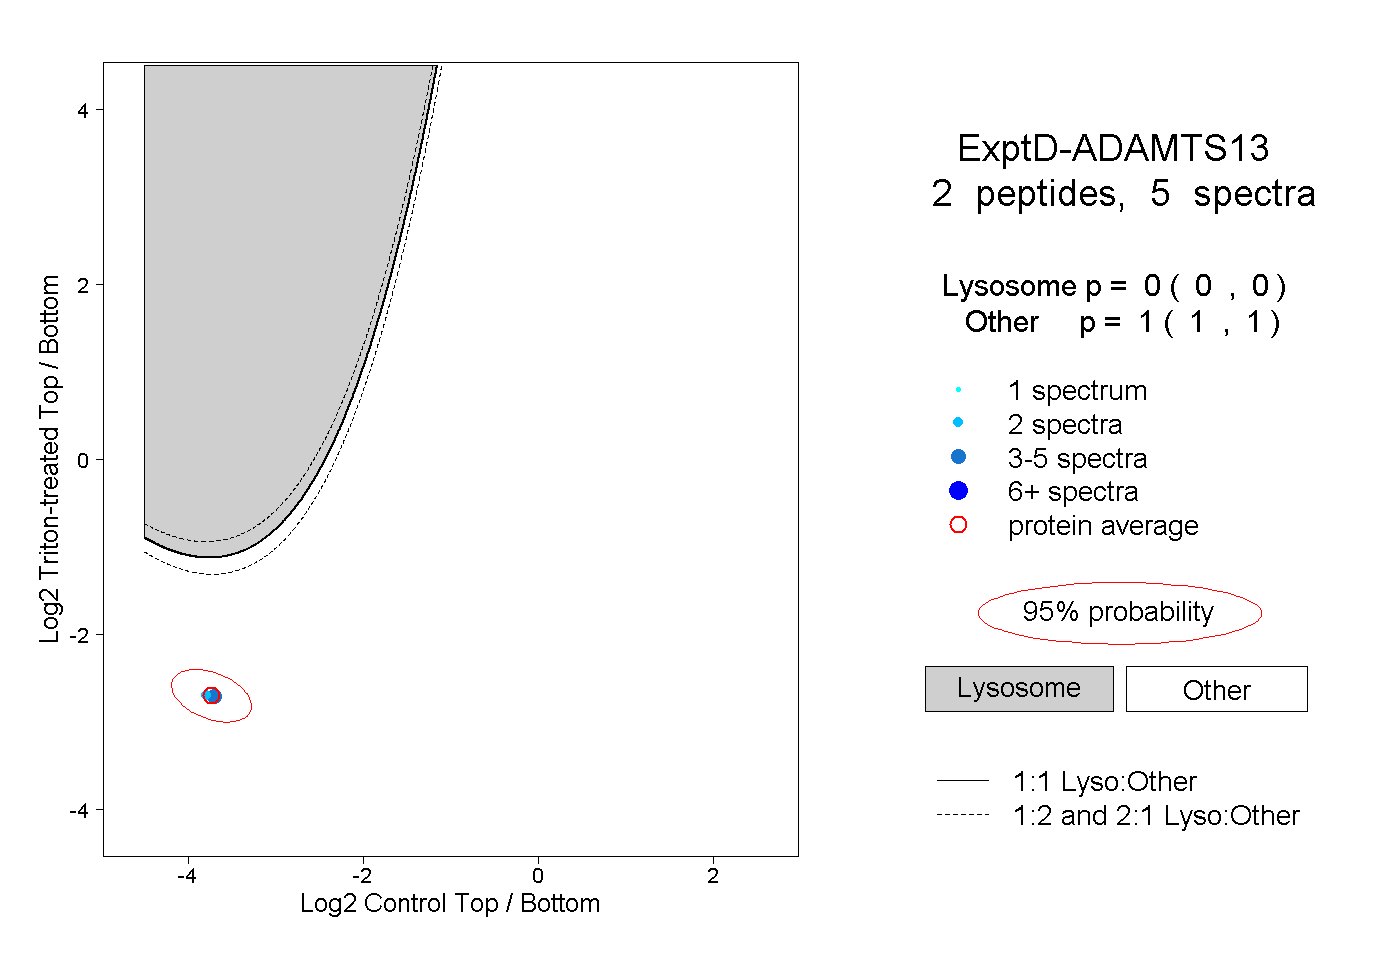 |
0.000 0.000 | 0.000 |
1.000 1.000 | 1.000 |