 11
11peptides
spectra
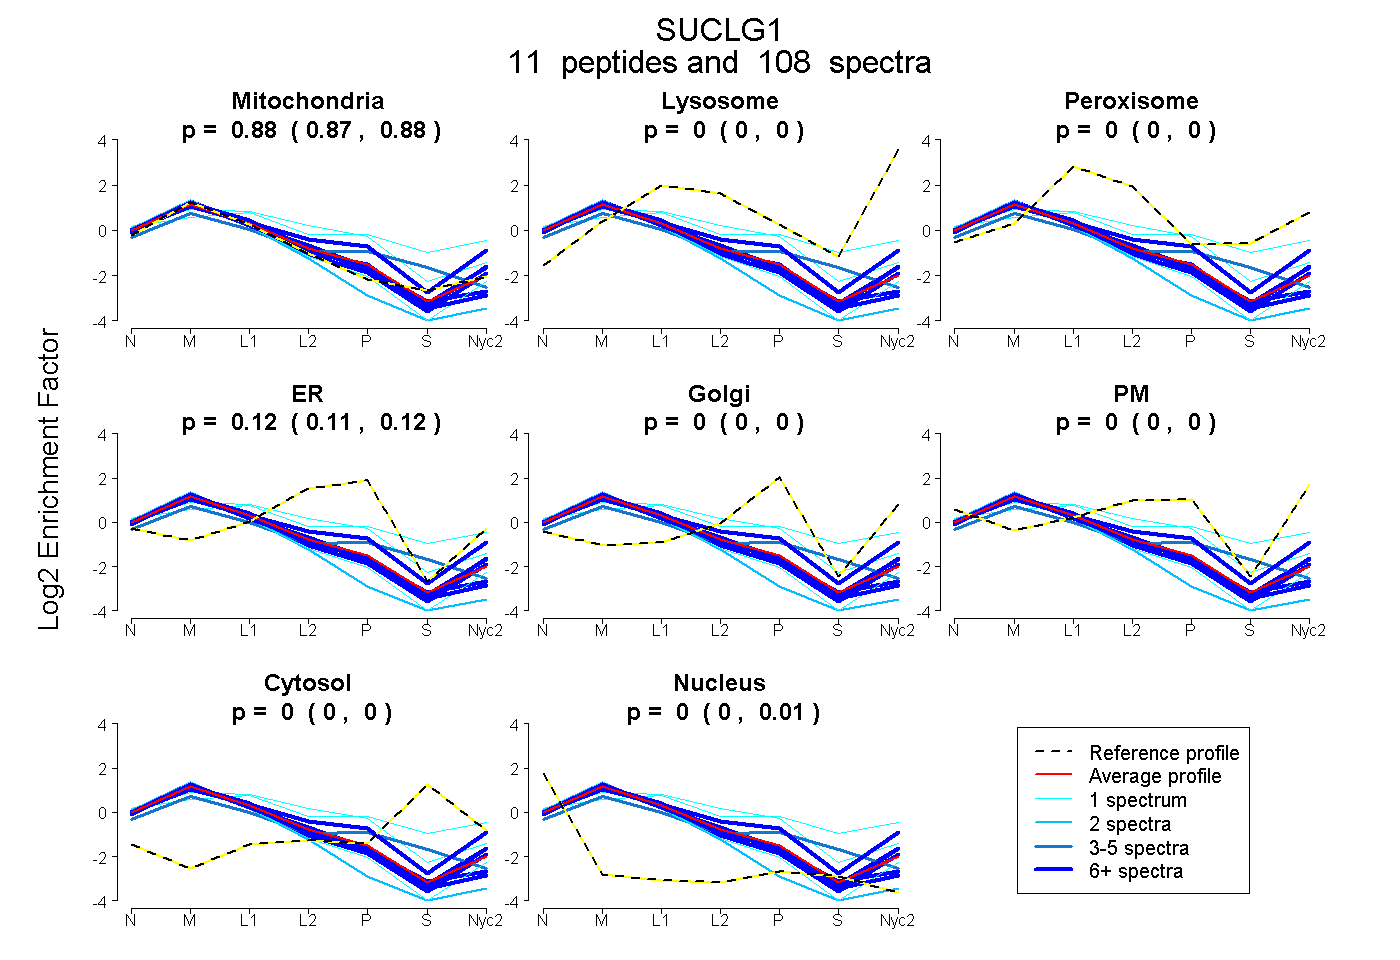
0.871 | 0.879
0.000 | 0.000
0.000 | 0.000
0.115 | 0.125
0.000 | 0.000
0.000 | 0.000
0.000 | 0.000
0.002 | 0.006
11peptides
spectra
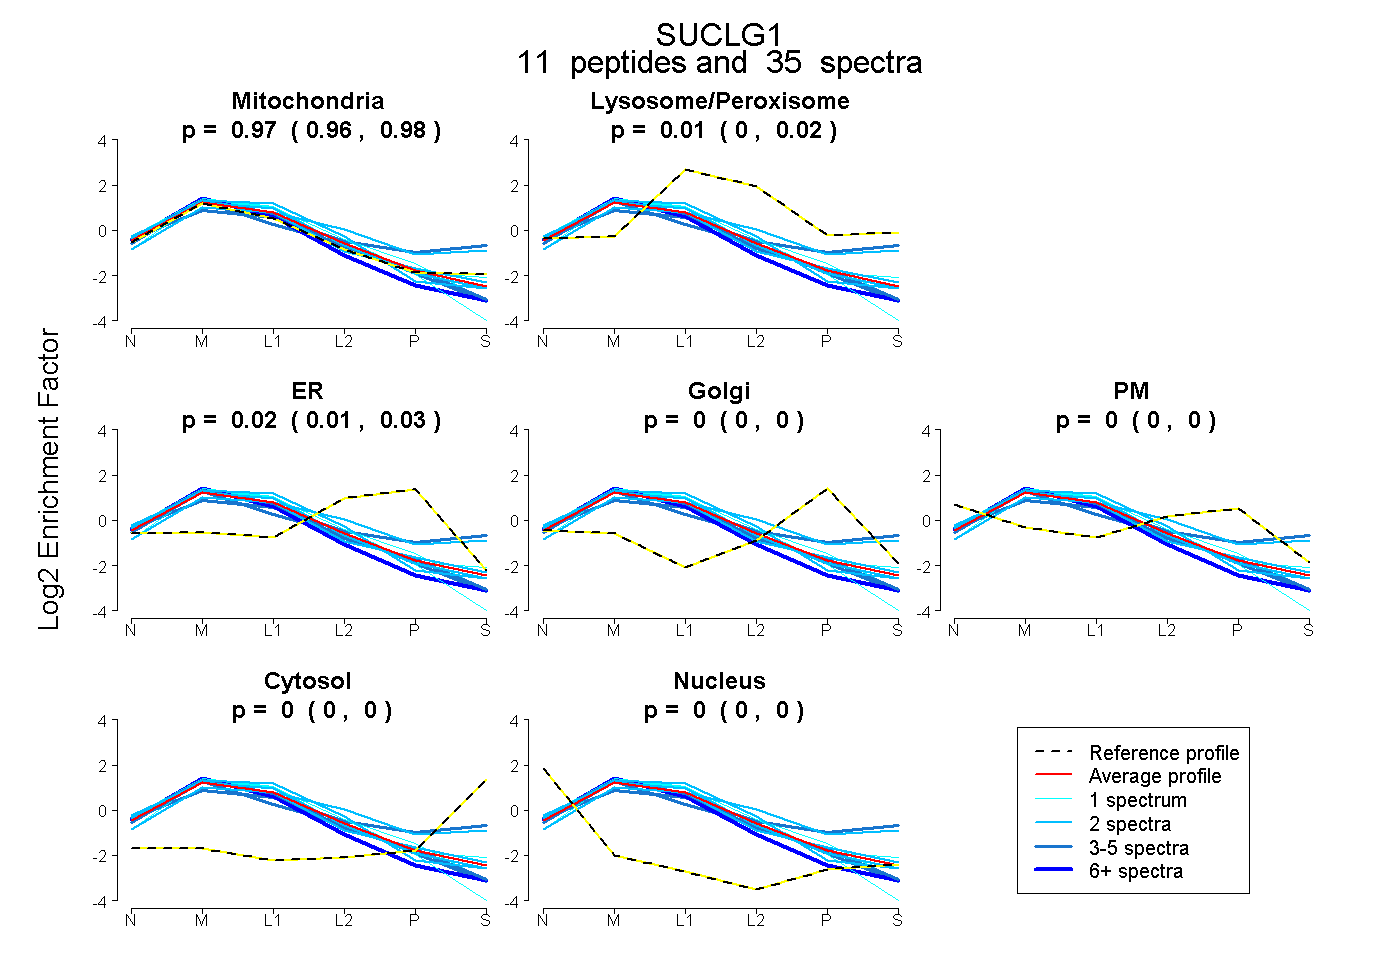
0.959 | 0.982
0.000 | 0.020
0.008 | 0.032
0.000 | 0.000
0.000 | 0.000
0.000 | 0.000
0.000 | 0.000
10peptides
spectra
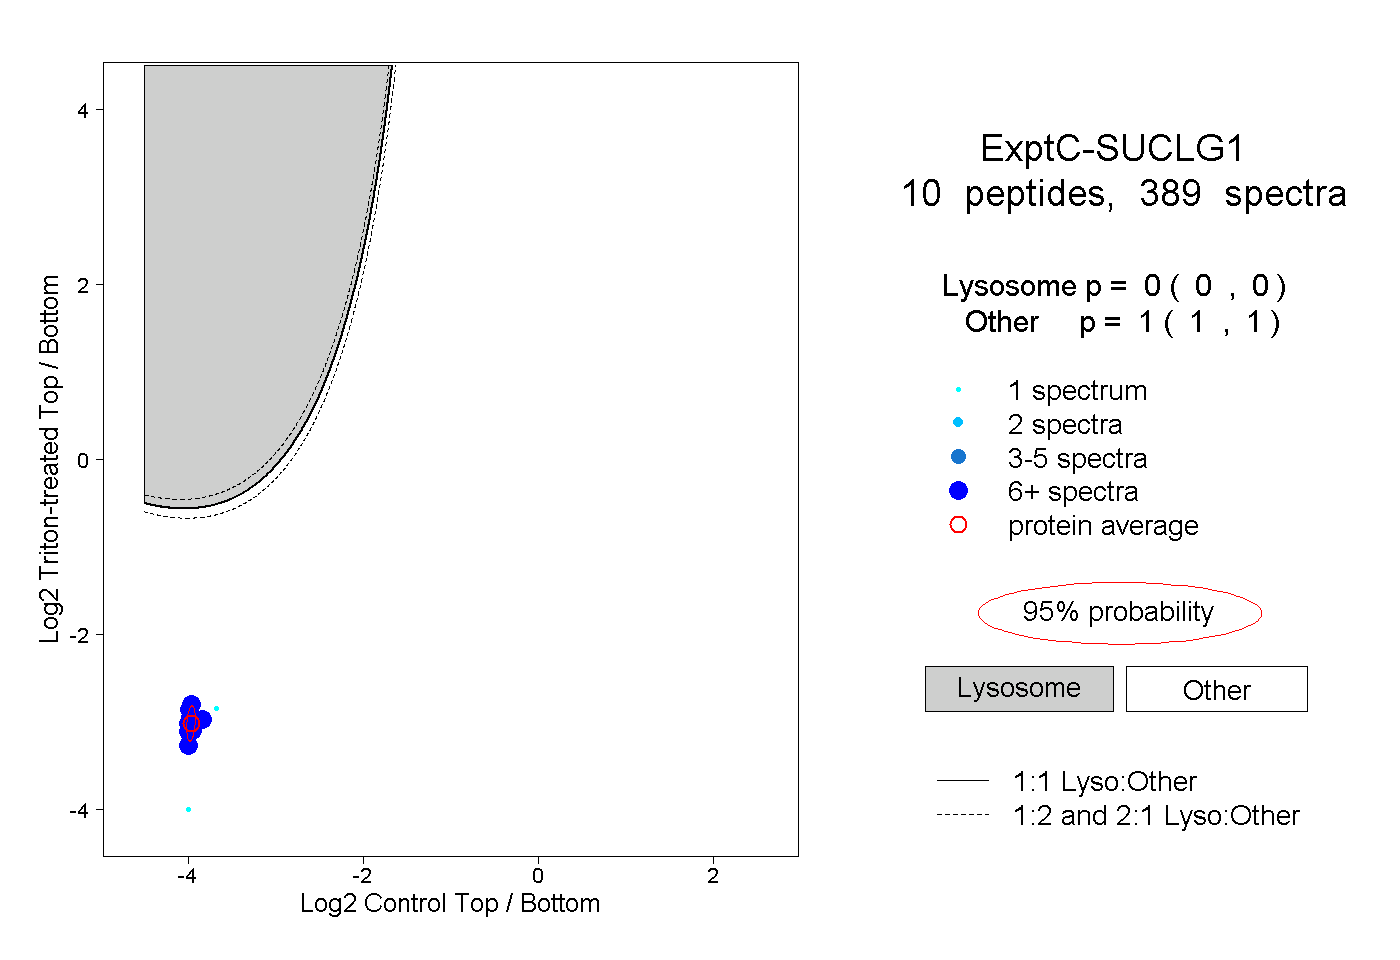
0.000 | 0.000
1.000 | 1.000
9peptides
spectra
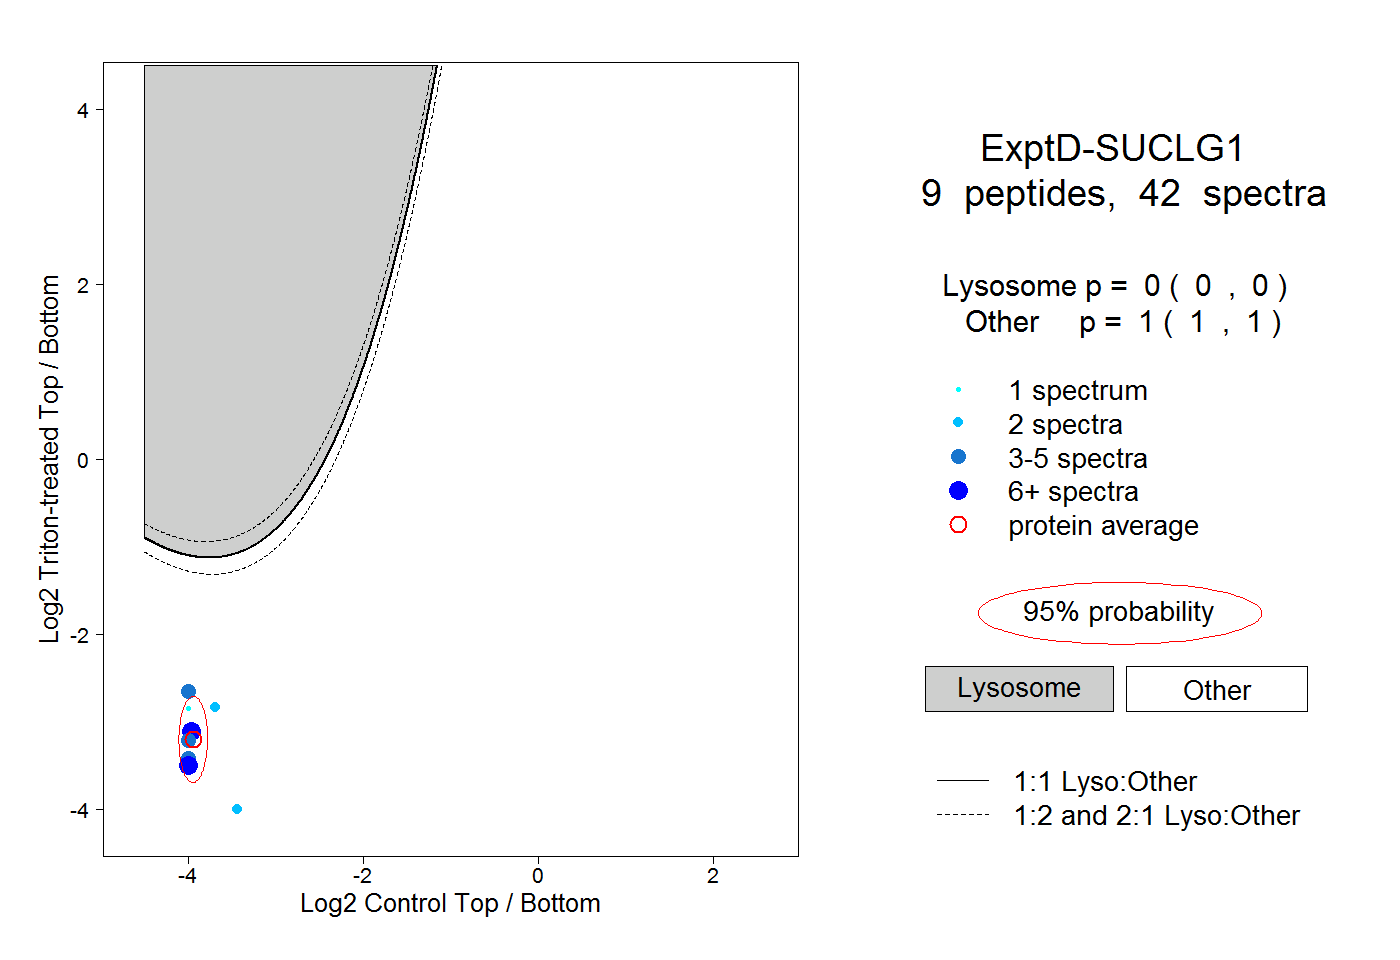
0.000 | 0.000
1.000 | 1.000