 11
11peptides
spectra
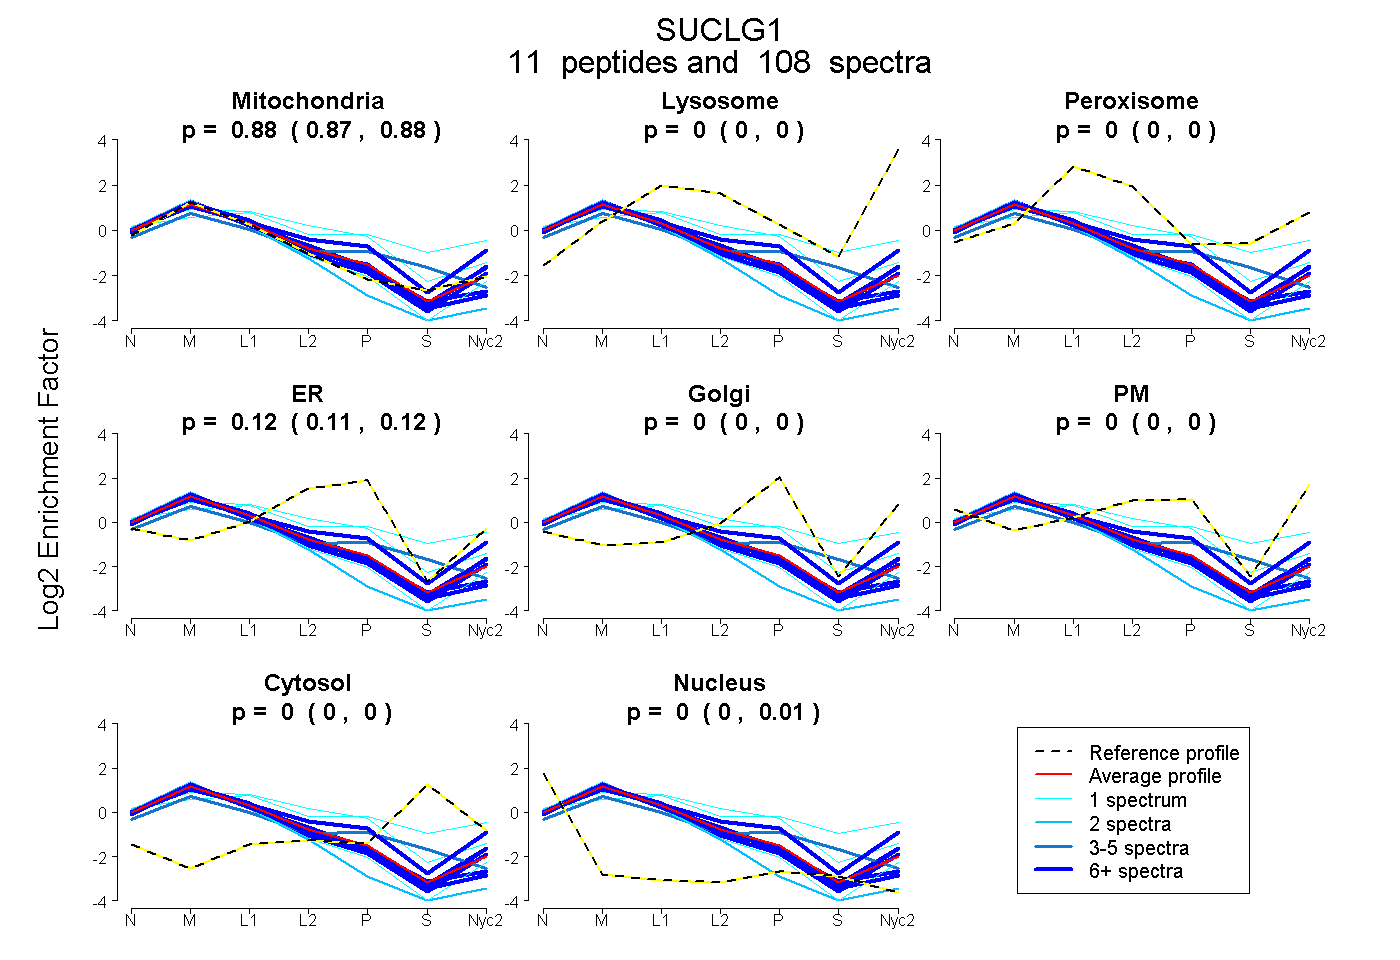
0.871 | 0.879
0.000 | 0.000
0.000 | 0.000
0.115 | 0.125
0.000 | 0.000
0.000 | 0.000
0.000 | 0.000
0.002 | 0.006
| Plot | Mito | Lyso | Perox | ER | Golgi | PM | Cytosol | Nucleus | |||||
| Expt A |
11 peptides |
108 spectra |
|
0.875 0.871 | 0.879 |
0.000 0.000 | 0.000 |
0.000 0.000 | 0.000 |
0.120 0.115 | 0.125 |
0.000 0.000 | 0.000 |
0.000 0.000 | 0.000 |
0.000 0.000 | 0.000 |
0.004 0.002 | 0.006 |
| 16 spectra, LGIVSR | 0.932 | 0.000 | 0.000 | 0.013 | 0.000 | 0.037 | 0.000 | 0.018 | ||
| 8 spectra, VICQGFTGK | 0.922 | 0.000 | 0.000 | 0.039 | 0.000 | 0.000 | 0.000 | 0.039 | ||
| 17 spectra, MGHAGAIIAGGK | 0.653 | 0.000 | 0.000 | 0.078 | 0.004 | 0.265 | 0.000 | 0.000 | ||
| 1 spectrum, AKPVVSFIAGITAPPGR | 0.543 | 0.000 | 0.138 | 0.319 | 0.000 | 0.000 | 0.000 | 0.000 | ||
| 13 spectra, QGTFHSQQALEYGTK | 0.875 | 0.000 | 0.000 | 0.012 | 0.023 | 0.091 | 0.000 | 0.000 | ||
| 3 spectra, LIGPNCPGIINPGECK | 0.724 | 0.000 | 0.000 | 0.127 | 0.000 | 0.000 | 0.133 | 0.016 | ||
| 1 spectrum, NIYIDK | 0.961 | 0.000 | 0.000 | 0.000 | 0.000 | 0.000 | 0.000 | 0.039 | ||
| 1 spectrum, EHNSGPK | 0.348 | 0.000 | 0.322 | 0.000 | 0.189 | 0.053 | 0.088 | 0.000 | ||
| 12 spectra, HLGLPVFNTVK | 0.874 | 0.000 | 0.000 | 0.055 | 0.000 | 0.071 | 0.000 | 0.000 | ||
| 34 spectra, IGIMPGHIHK | 0.929 | 0.000 | 0.000 | 0.051 | 0.000 | 0.000 | 0.000 | 0.020 | ||
| 2 spectra, LVGGTTPGK | 0.897 | 0.000 | 0.000 | 0.000 | 0.000 | 0.000 | 0.000 | 0.103 |
| Plot | Mito | Lyso or Perox | ER | Golgi | PM | Cytosol | Nucleus | ||||||
| Expt B |
11 peptides |
35 spectra |
 |
0.971 0.959 | 0.982 |
0.007 0.000 | 0.020 |
0.021 0.008 | 0.032 |
0.000 0.000 | 0.000 |
0.000 0.000 | 0.000 |
0.000 0.000 | 0.000 |
0.000 0.000 | 0.000 |
|||
| Plot | Lyso | Other | |||||||||||
| Expt C |
10 peptides |
389 spectra |
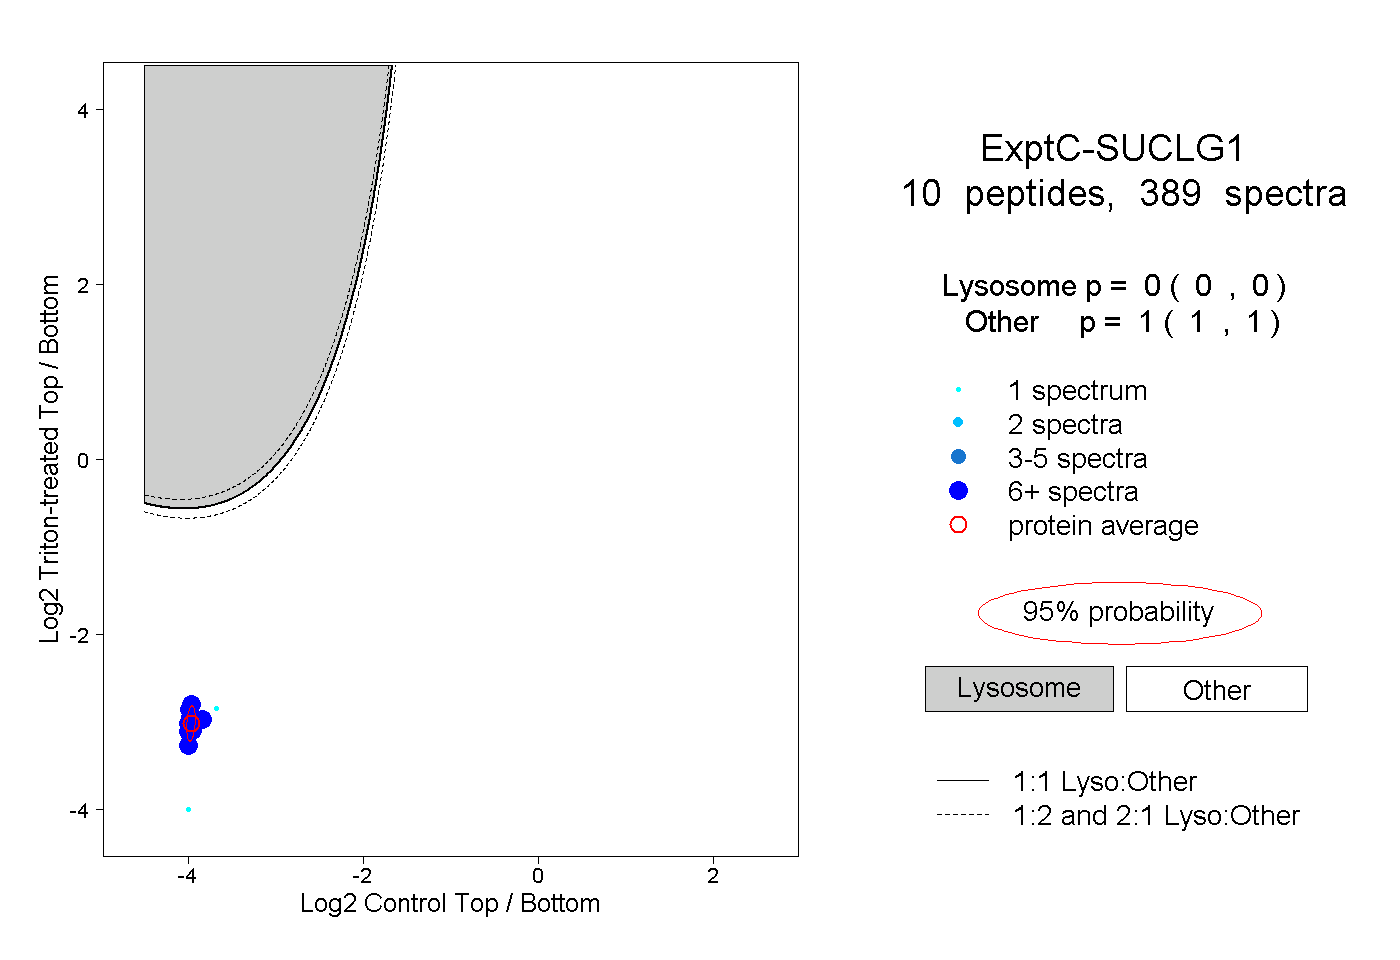 |
0.000 0.000 | 0.000 |
1.000 1.000 | 1.000 |
||||||||
| Plot | Lyso | Other | |||||||||||
| Expt D |
9 peptides |
42 spectra |
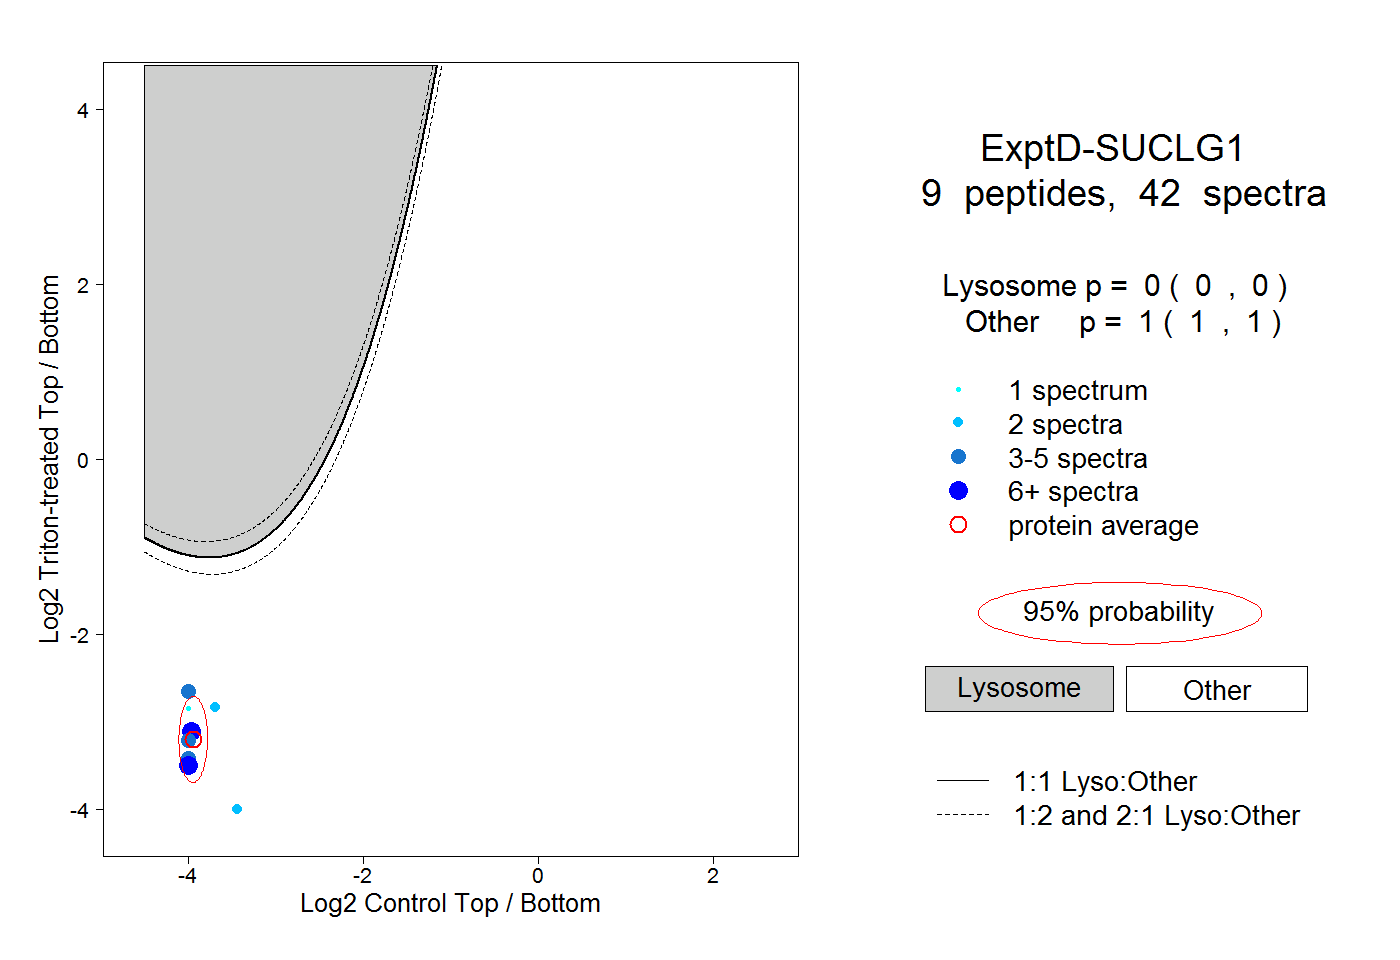 |
0.000 0.000 | 0.000 |
1.000 1.000 | 1.000 |