 21
21peptides
spectra
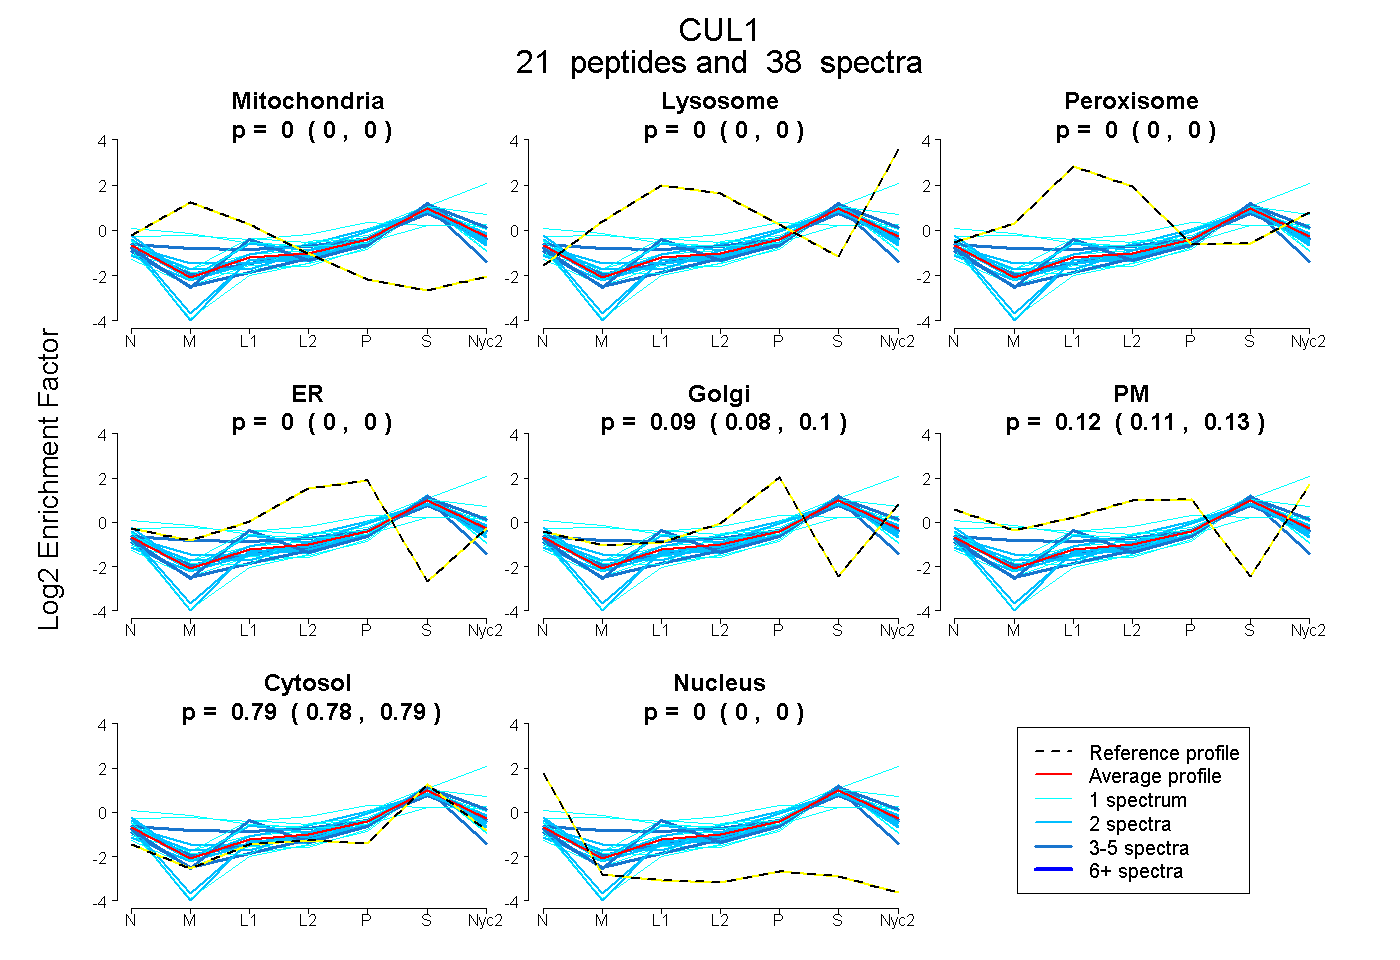
0.000 | 0.000
0.000 | 0.000
0.000 | 0.000
0.000 | 0.000
0.075 | 0.101
0.108 | 0.135
0.784 | 0.792
0.000 | 0.000
4peptides
spectra
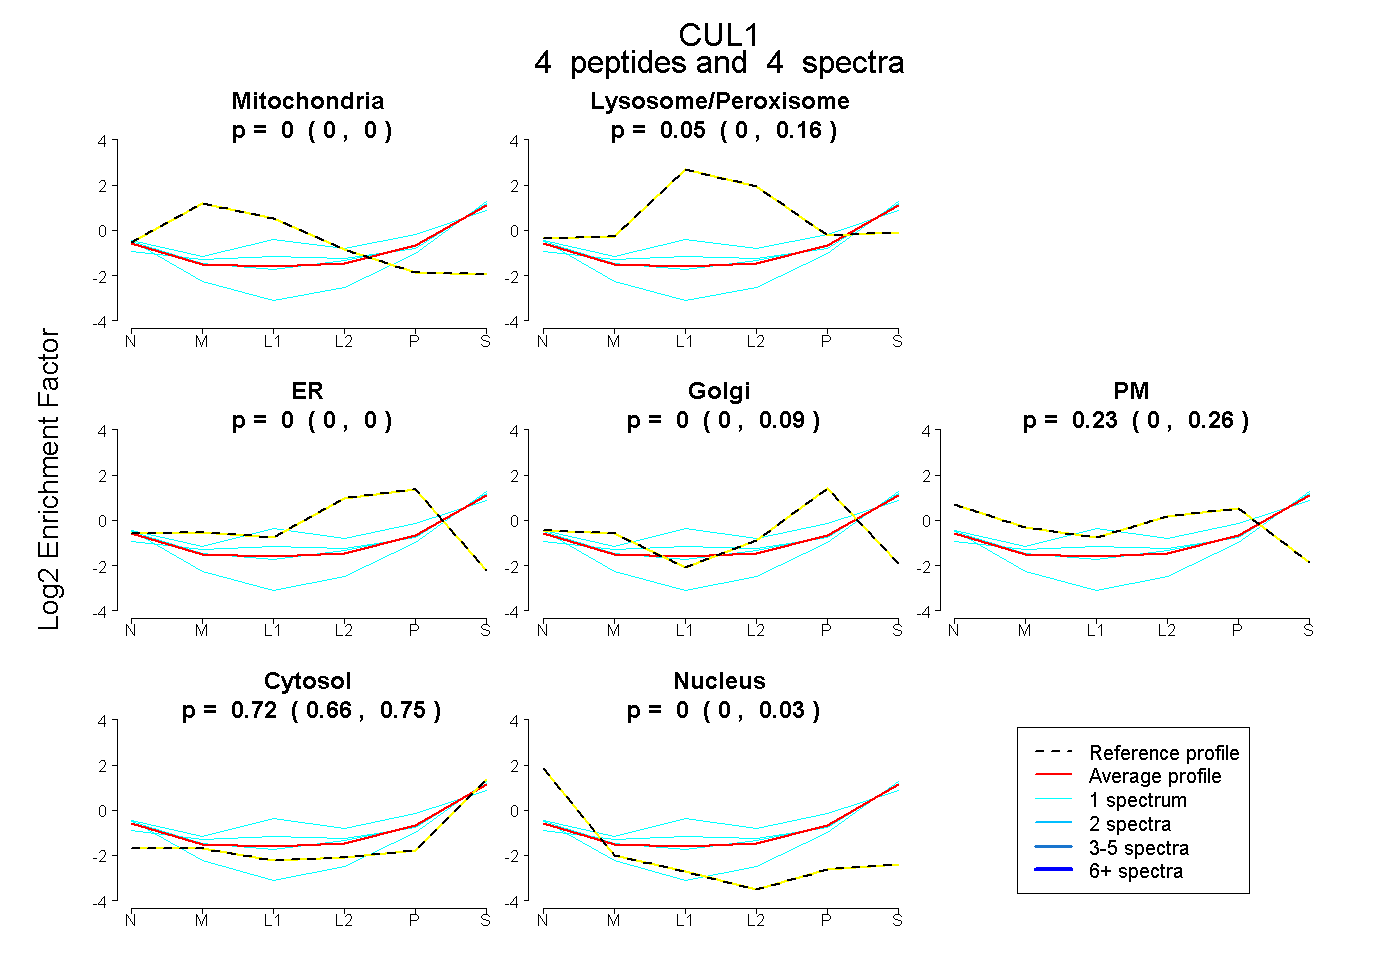
0.000 | 0.000
0.000 | 0.165
0.000 | 0.000
0.000 | 0.093
0.000 | 0.262
0.659 | 0.751
0.000 | 0.035
10peptides
spectra
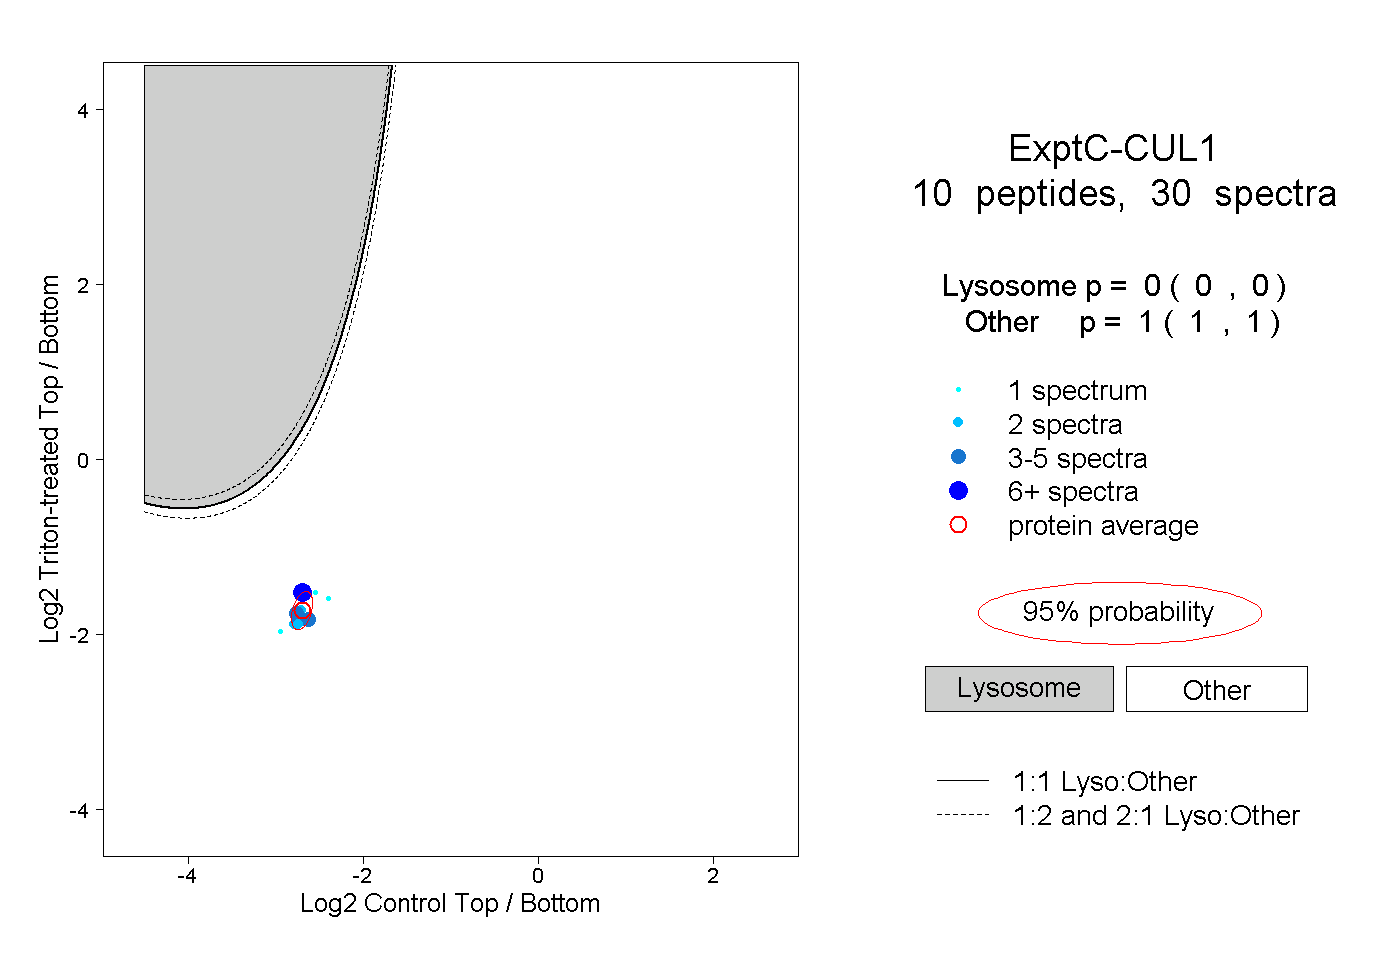
0.000 | 0.000
1.000 | 1.000