 1
1peptide
spectra
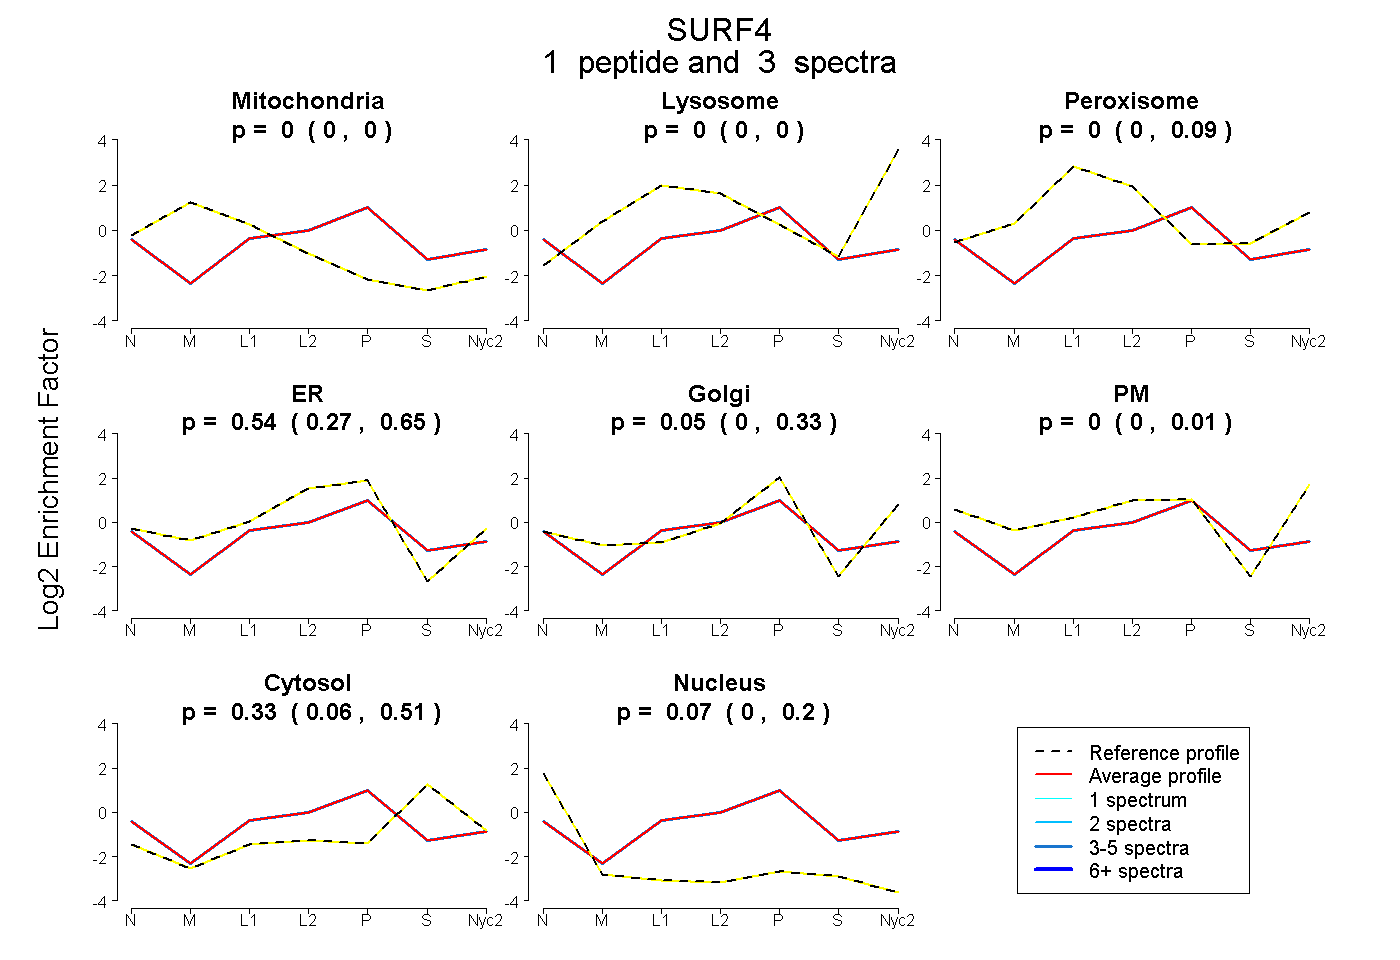
0.000 | 0.000
0.000 | 0.000
0.000 | 0.088
0.274 | 0.645
0.000 | 0.329
0.000 | 0.009
0.059 | 0.511
0.000 | 0.196
4peptides
spectra
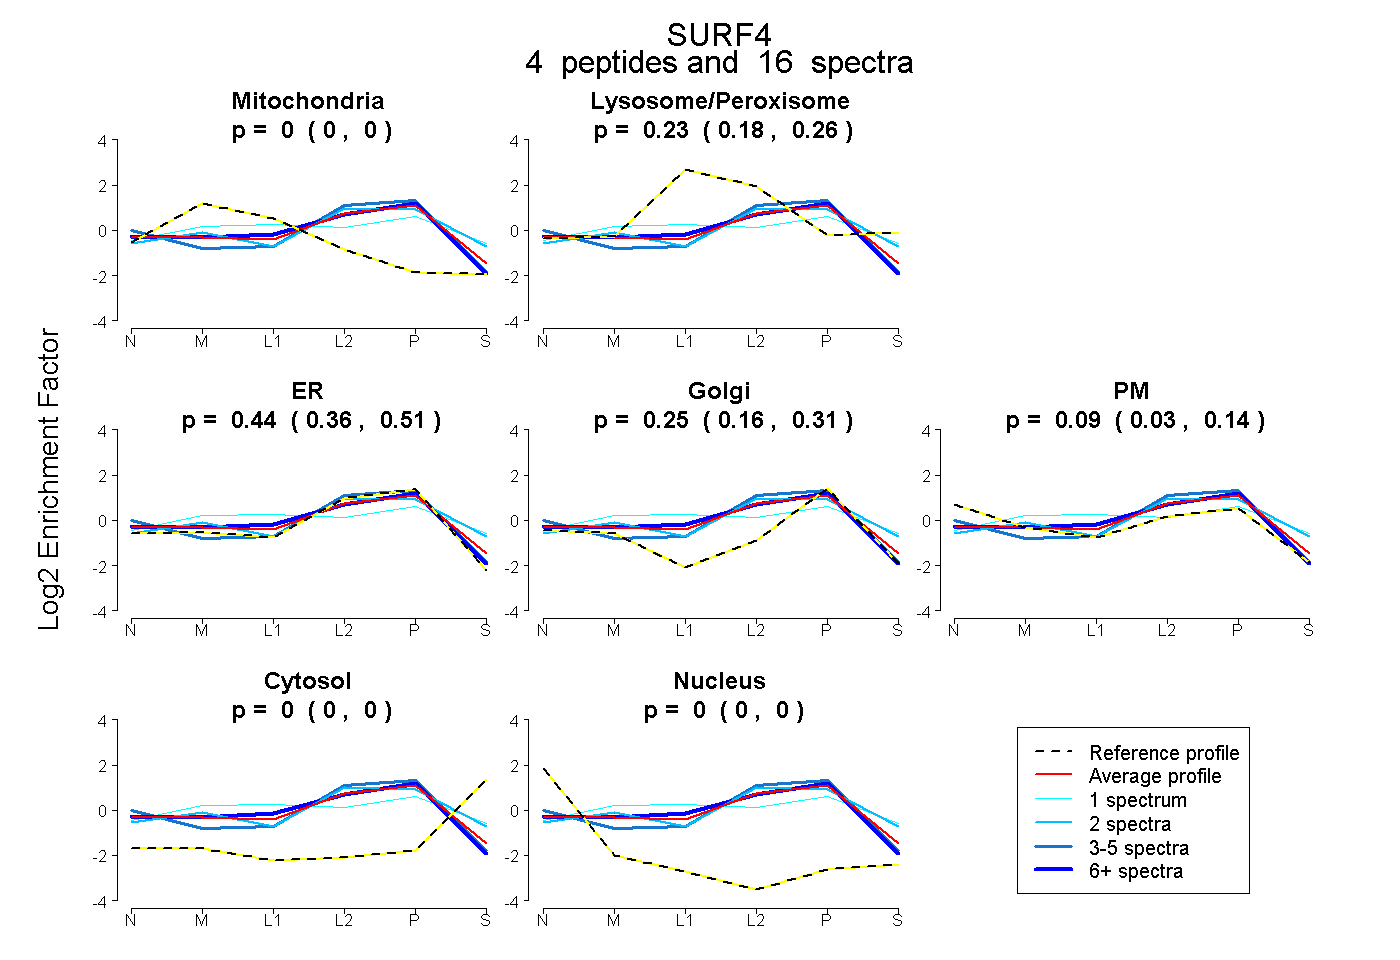
0.000 | 0.000
0.183 | 0.260
0.356 | 0.508
0.163 | 0.315
0.028 | 0.137
0.000 | 0.000
0.000 | 0.000