 7
7peptides
spectra
0.000 | 0.000
0.010 | 0.038
0.000 | 0.000
0.000 | 0.000
0.000 | 0.000
0.213 | 0.240
0.736 | 0.755
0.000 | 0.000
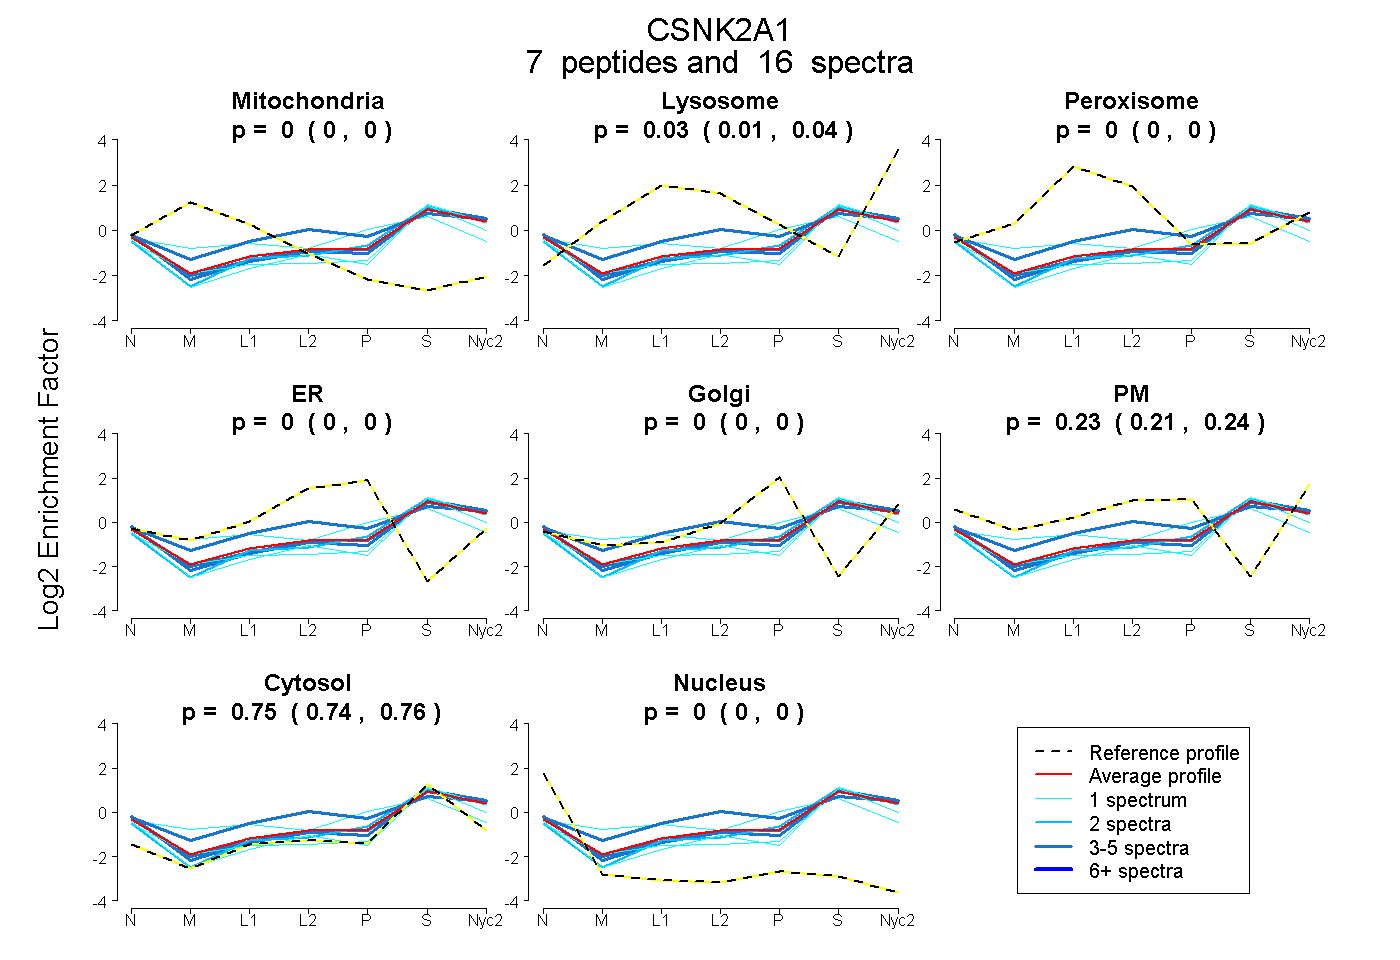
| Plot | Mito | Lyso | Perox | ER | Golgi | PM | Cytosol | Nucleus | |||||
| Expt A |
7 peptides |
16 spectra |
|
0.000 0.000 | 0.000 |
0.026 0.010 | 0.038 |
0.000 0.000 | 0.000 |
0.000 0.000 | 0.000 |
0.000 0.000 | 0.000 |
0.227 0.213 | 0.240 |
0.746 0.736 | 0.755 |
0.000 0.000 | 0.000 |
| 2 spectra, TPALVFEHVNNTDFK | 0.000 | 0.000 | 0.000 | 0.000 | 0.000 | 0.189 | 0.811 | 0.000 | ||
| 4 spectra, FNDILGR | 0.000 | 0.008 | 0.000 | 0.000 | 0.000 | 0.245 | 0.747 | 0.000 | ||
| 4 spectra, ILENLR | 0.000 | 0.000 | 0.000 | 0.000 | 0.000 | 0.223 | 0.777 | 0.000 | ||
| 1 spectrum, YNIELDPR | 0.000 | 0.011 | 0.000 | 0.000 | 0.000 | 0.117 | 0.843 | 0.029 | ||
| 1 spectrum, FYMYELLK | 0.068 | 0.000 | 0.159 | 0.000 | 0.227 | 0.000 | 0.546 | 0.000 | ||
| 3 spectra, VYTDVNTHRPR | 0.000 | 0.054 | 0.122 | 0.000 | 0.000 | 0.262 | 0.563 | 0.000 | ||
| 1 spectrum, VLGTEDLYDYIDK | 0.000 | 0.000 | 0.000 | 0.000 | 0.000 | 0.127 | 0.873 | 0.000 |
| Plot | Mito | Lyso or Perox | ER | Golgi | PM | Cytosol | Nucleus | ||||||
| Expt B |
4 peptides |
9 spectra |
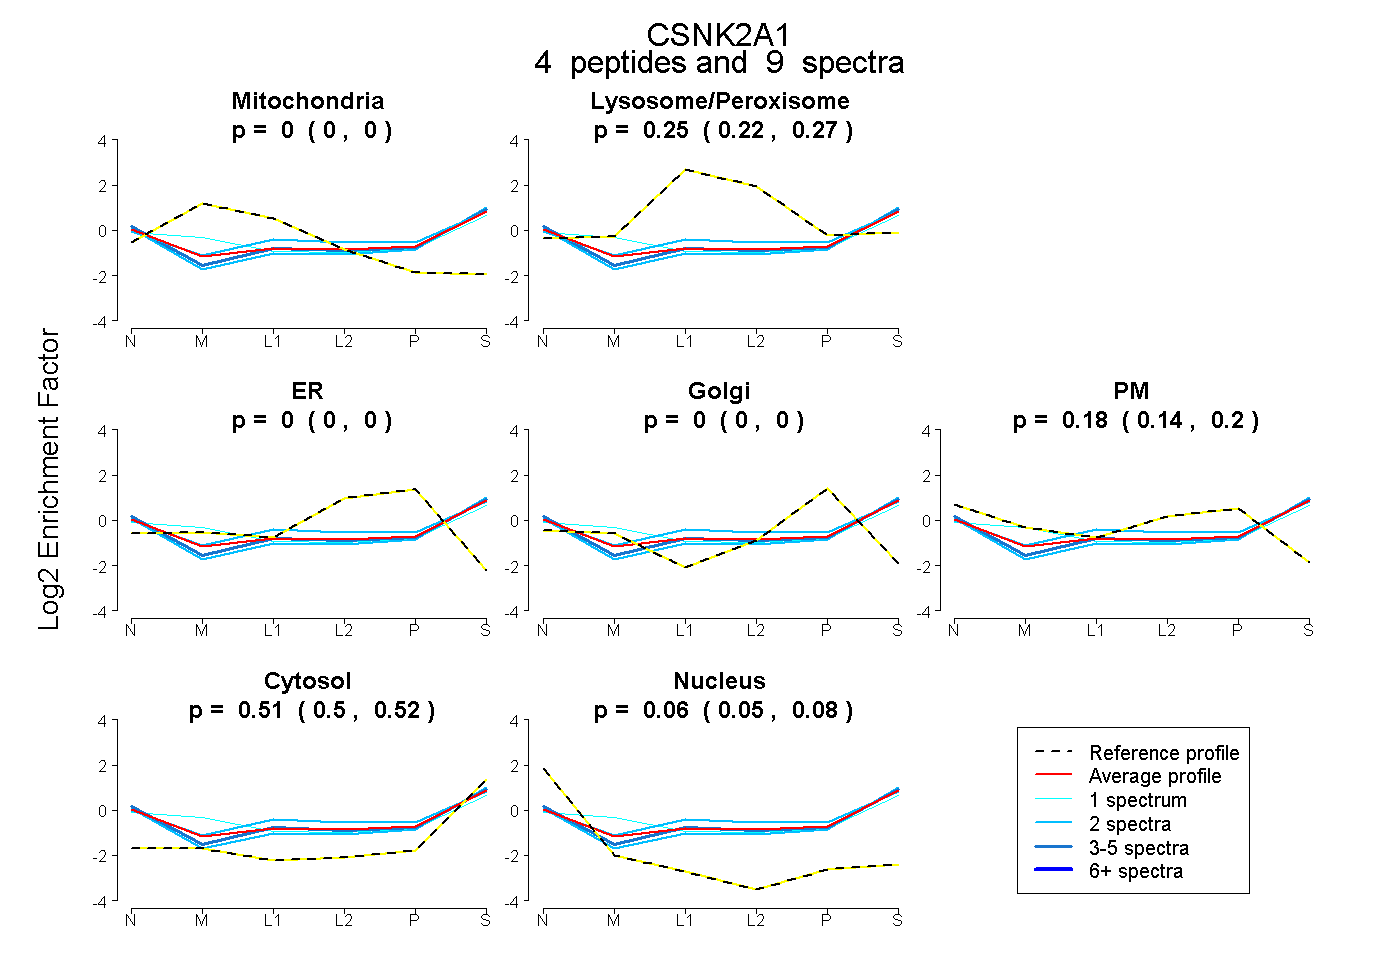 |
0.000 0.000 | 0.000 |
0.247 0.224 | 0.267 |
0.000 0.000 | 0.000 |
0.000 0.000 | 0.000 |
0.178 0.142 | 0.205 |
0.510 0.497 | 0.521 |
0.065 0.046 | 0.082 |
|||
| Plot | Lyso | Other | |||||||||||
| Expt C |
7 peptides |
21 spectra |
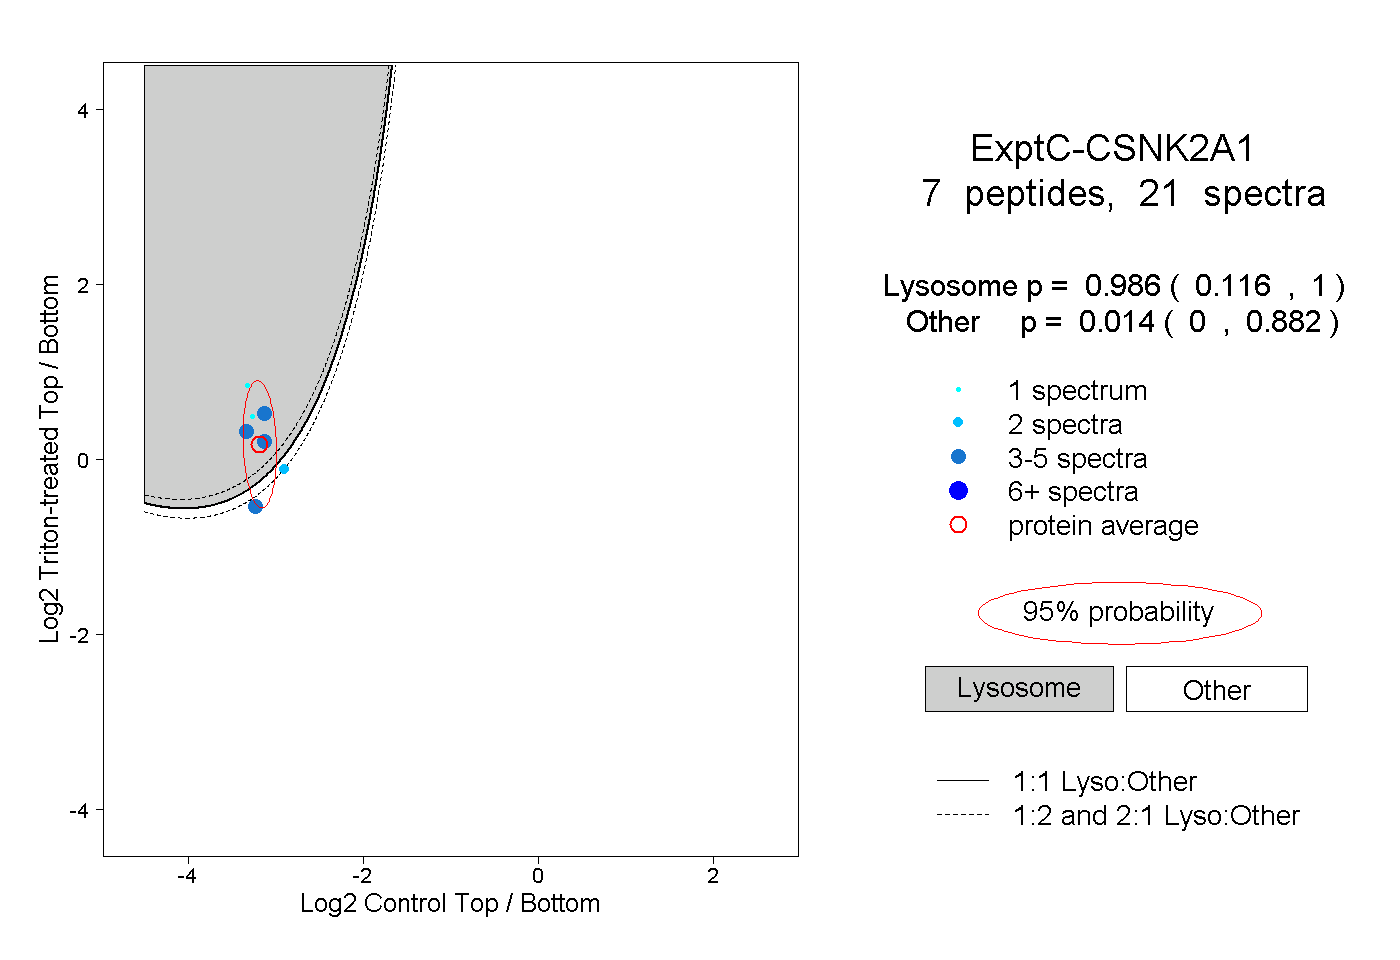 |
0.986 0.116 | 1.000 |
0.014 0.000 | 0.882 |
||||||||
| Plot | Lyso | Other | |||||||||||
| Expt D |
1 peptide |
1 spectrum |
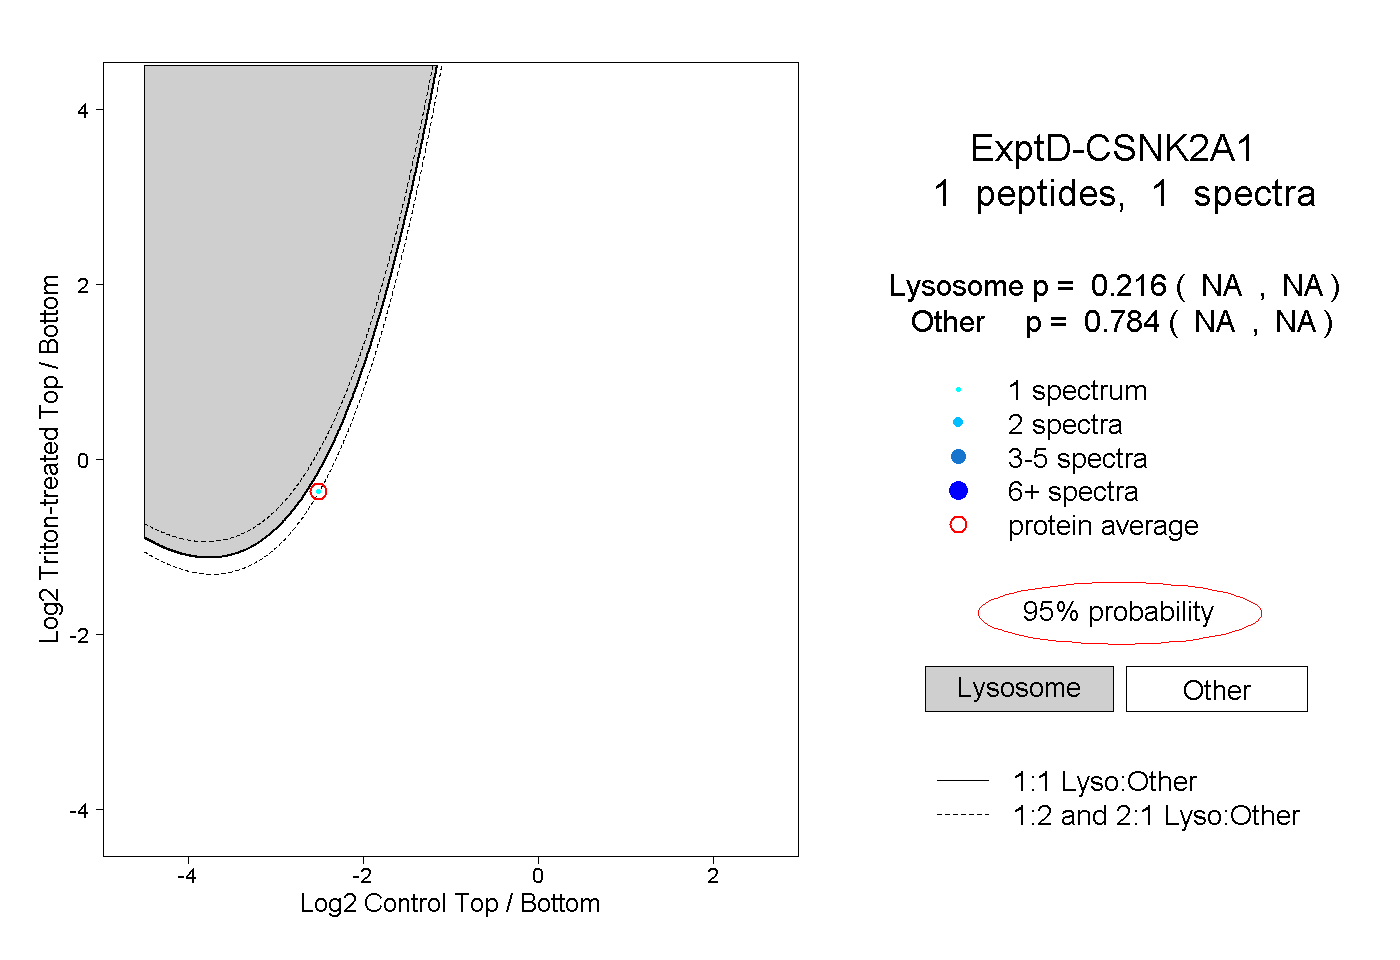 |
0.216 NA | NA |
0.784 NA | NA |