 8
8peptides
spectra
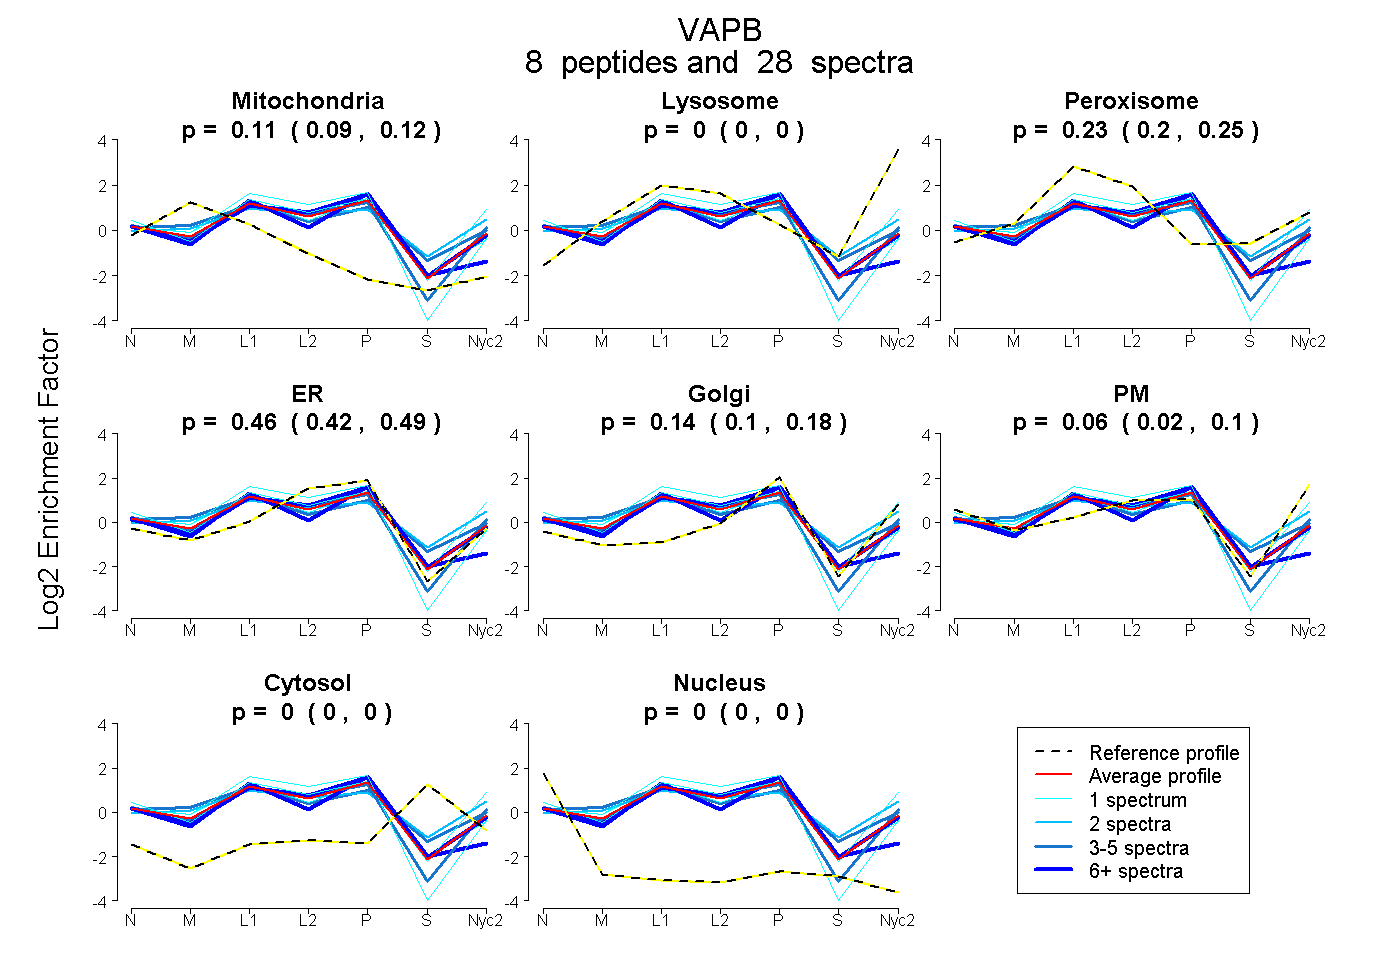
0.093 | 0.117
0.000 | 0.000
0.204 | 0.255
0.415 | 0.493
0.099 | 0.178
0.017 | 0.095
0.000 | 0.000
0.000 | 0.000
3peptides
spectra
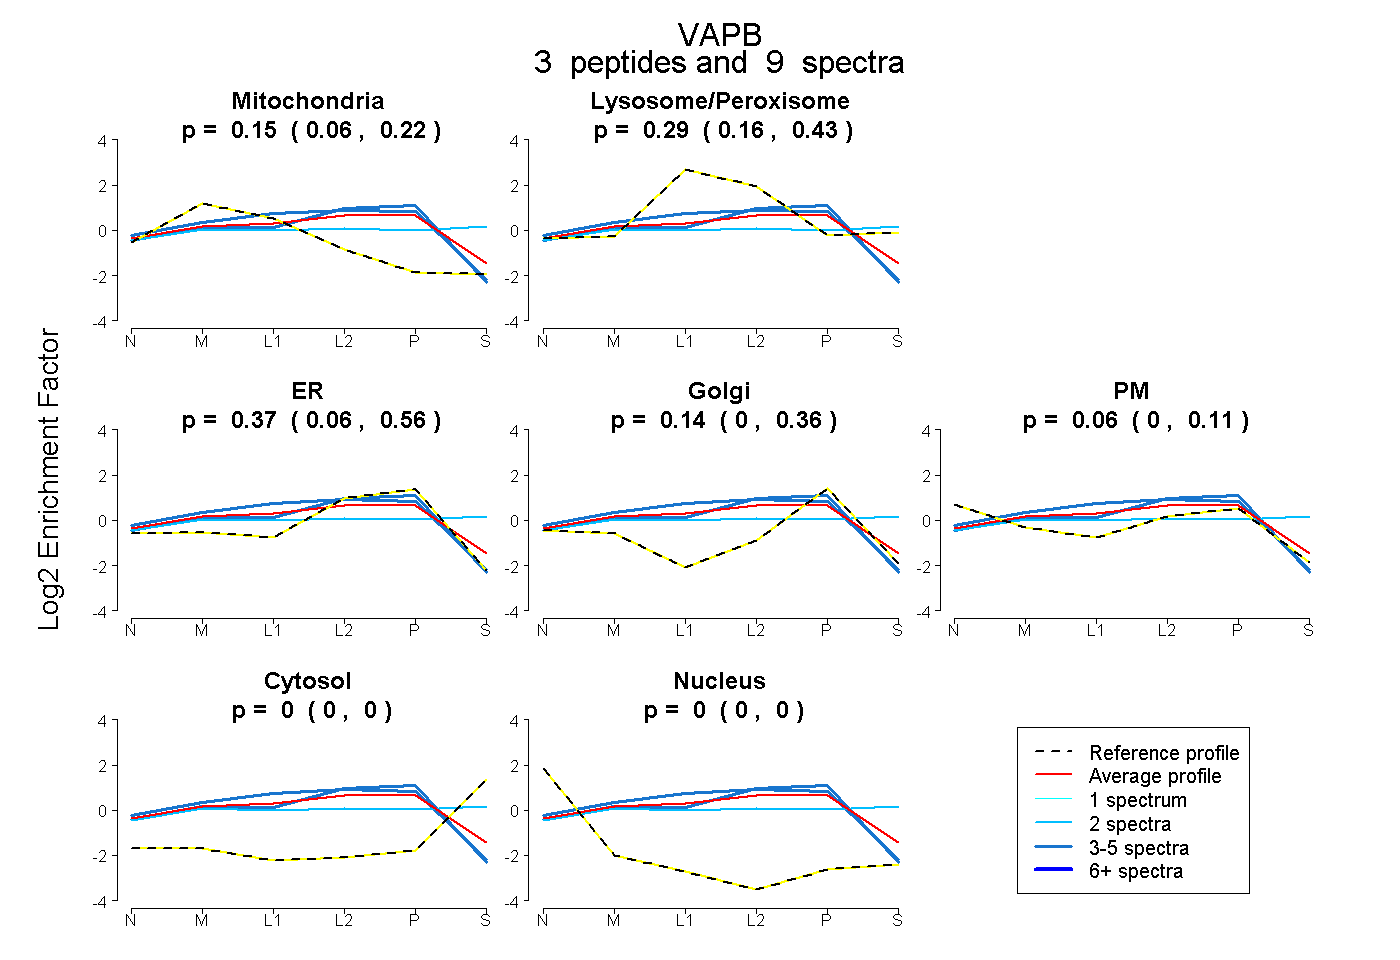
0.057 | 0.217
0.162 | 0.429
0.060 | 0.557
0.000 | 0.360
0.000 | 0.106
0.000 | 0.000
0.000 | 0.000
4peptides
spectra
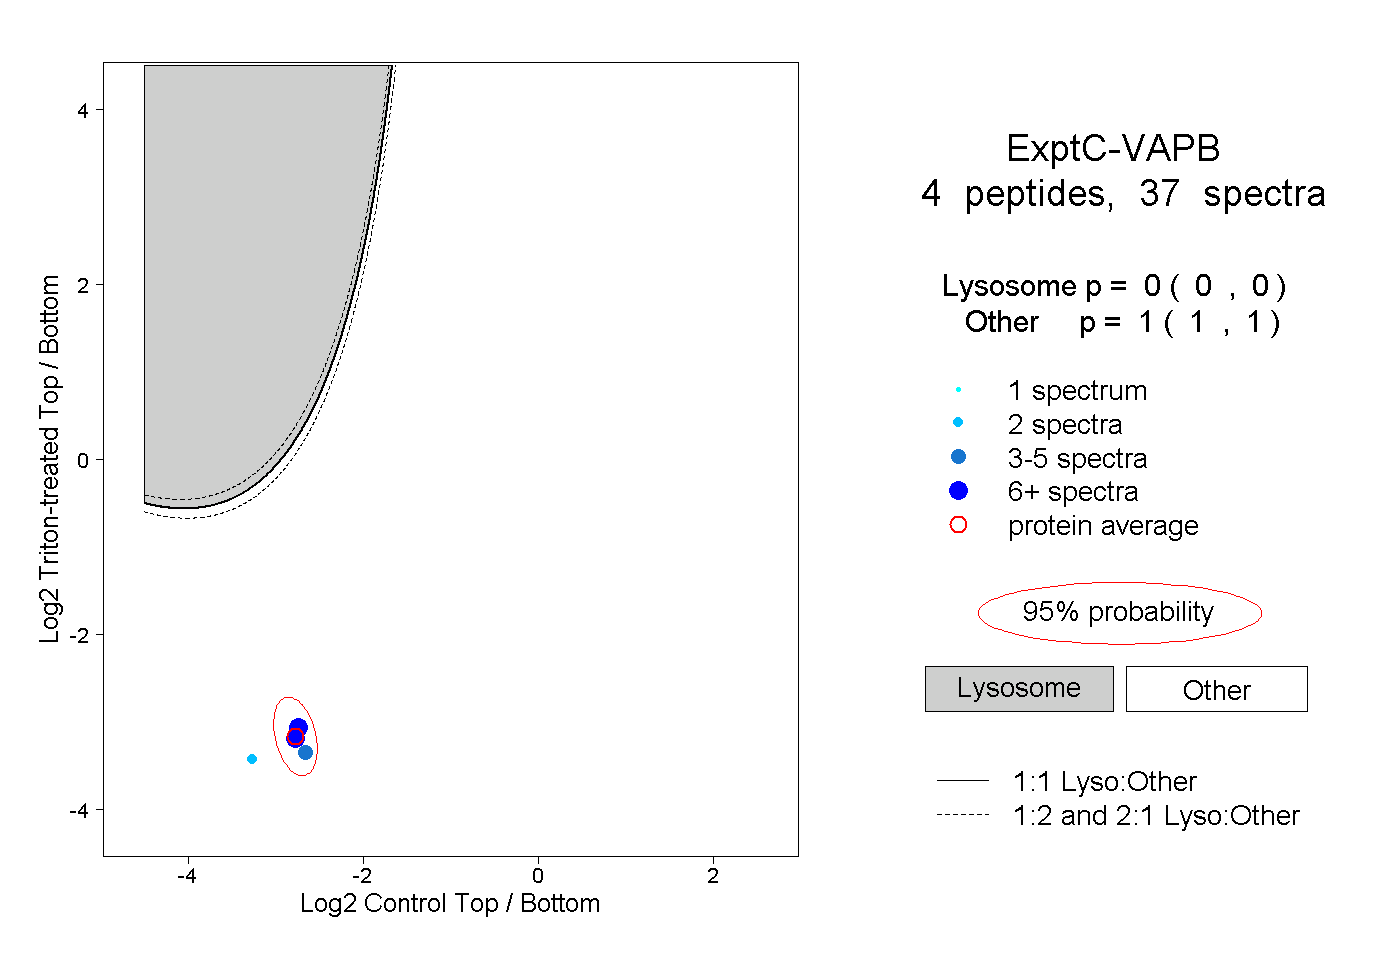
0.000 | 0.000
1.000 | 1.000
1peptide
spectra
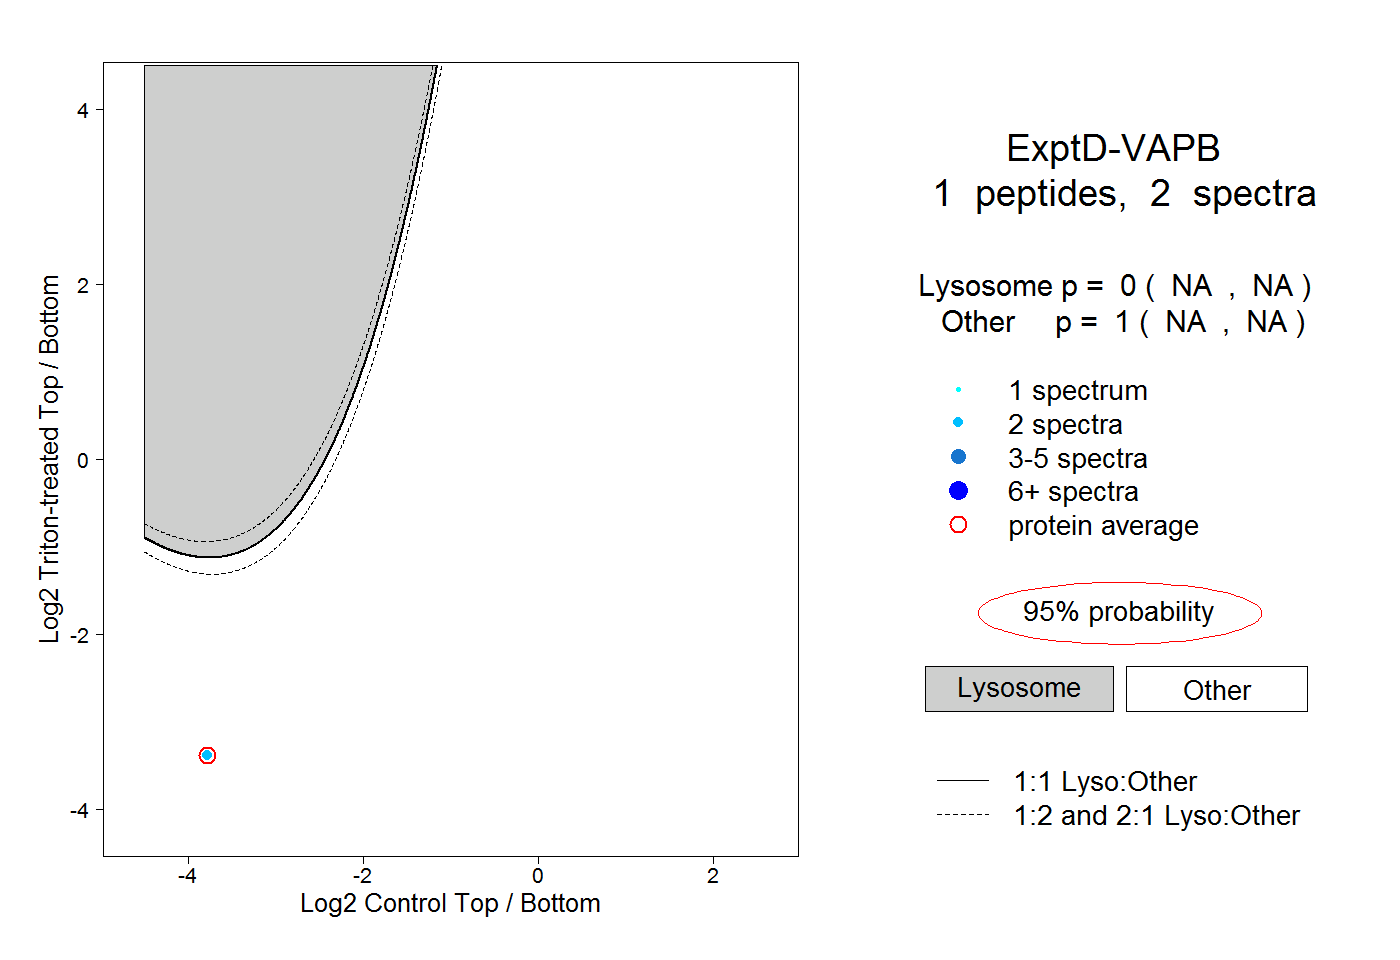
NA | NA
NA | NA