 4
4peptides
spectra
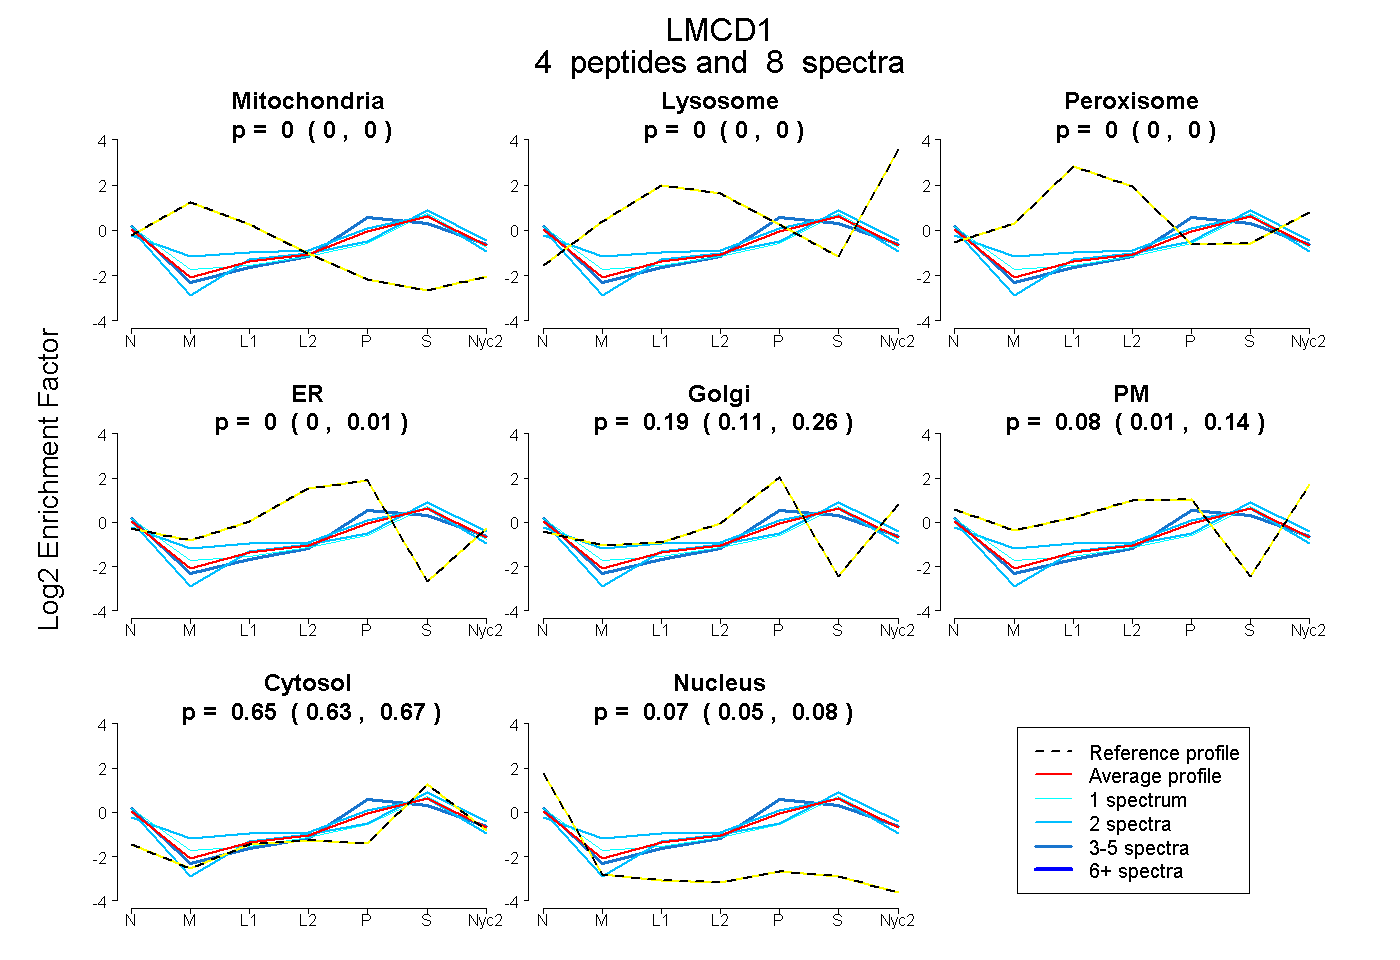
0.000 | 0.000
0.000 | 0.000
0.000 | 0.000
0.000 | 0.008
0.109 | 0.265
0.013 | 0.138
0.628 | 0.673
0.054 | 0.085
| Plot | Mito | Lyso | Perox | ER | Golgi | PM | Cytosol | Nucleus | |||||
| Expt A |
4 peptides |
8 spectra |
|
0.000 0.000 | 0.000 |
0.000 0.000 | 0.000 |
0.000 0.000 | 0.000 |
0.000 0.000 | 0.008 |
0.194 0.109 | 0.265 |
0.083 0.013 | 0.138 |
0.653 0.628 | 0.673 |
0.071 0.054 | 0.085 |
| 2 spectra, HYCESLRPR | 0.083 | 0.000 | 0.022 | 0.113 | 0.157 | 0.000 | 0.626 | 0.000 | ||
| 2 spectra, VEDLAWHR | 0.000 | 0.000 | 0.000 | 0.000 | 0.006 | 0.166 | 0.766 | 0.061 | ||
| 3 spectra, AMEEFVK | 0.000 | 0.000 | 0.000 | 0.000 | 0.363 | 0.000 | 0.545 | 0.092 | ||
| 1 spectrum, QPVTGTEGALYR | 0.000 | 0.000 | 0.000 | 0.000 | 0.000 | 0.207 | 0.679 | 0.114 |
| Plot | Mito | Lyso or Perox | ER | Golgi | PM | Cytosol | Nucleus | ||||||
| Expt B |
1 peptide |
2 spectra |
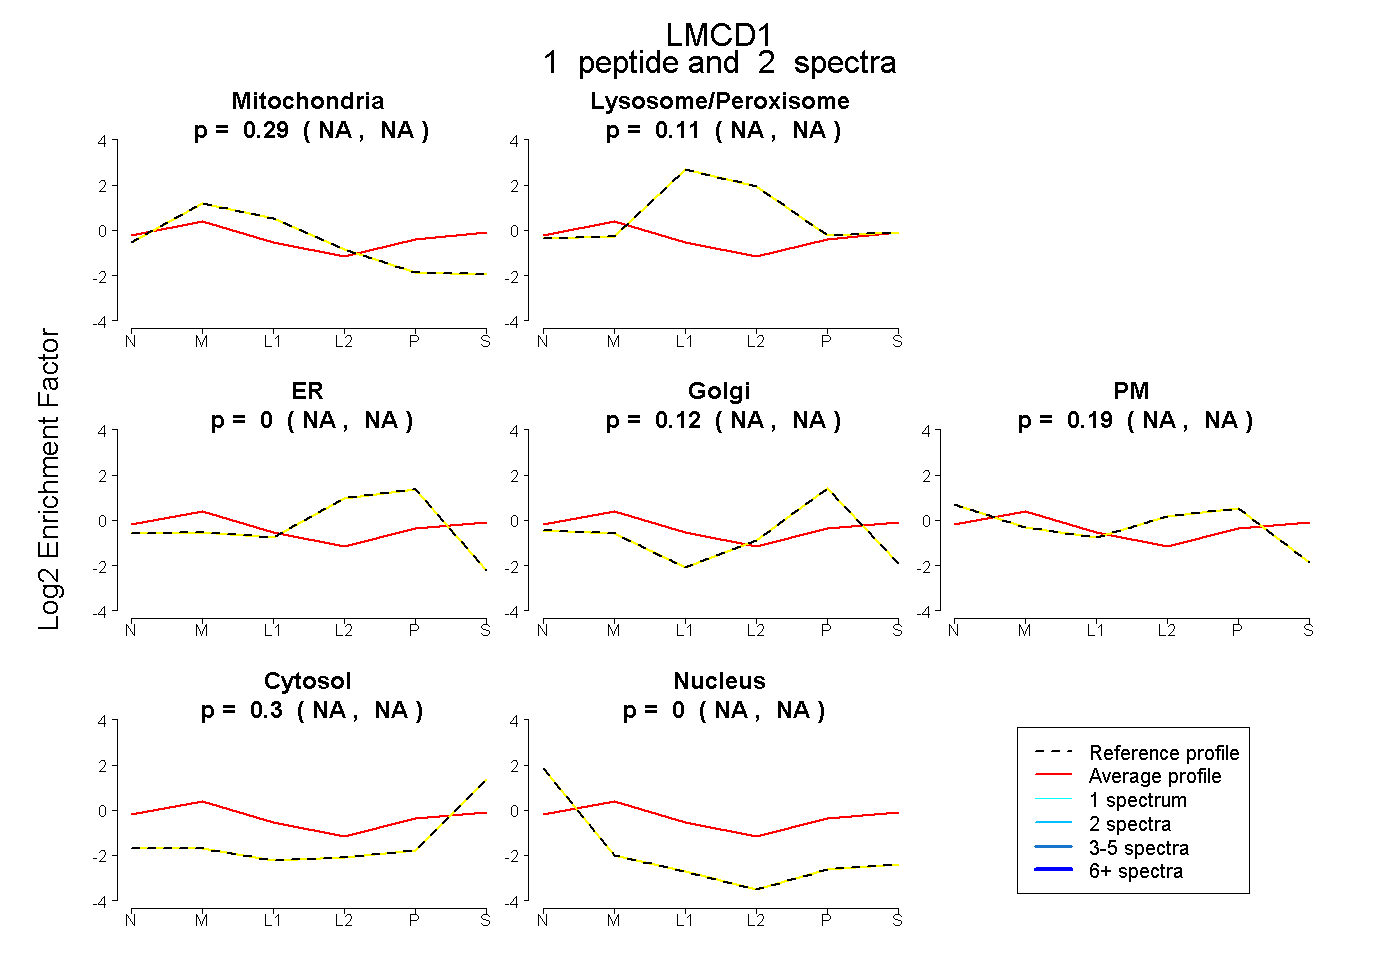 |
0.288 NA | NA |
0.105 NA | NA |
0.000 NA | NA |
0.120 NA | NA |
0.191 NA | NA |
0.295 NA | NA |
0.000 NA | NA |
|||
| Plot | Lyso | Other | |||||||||||
| Expt C |
4 peptides |
9 spectra |
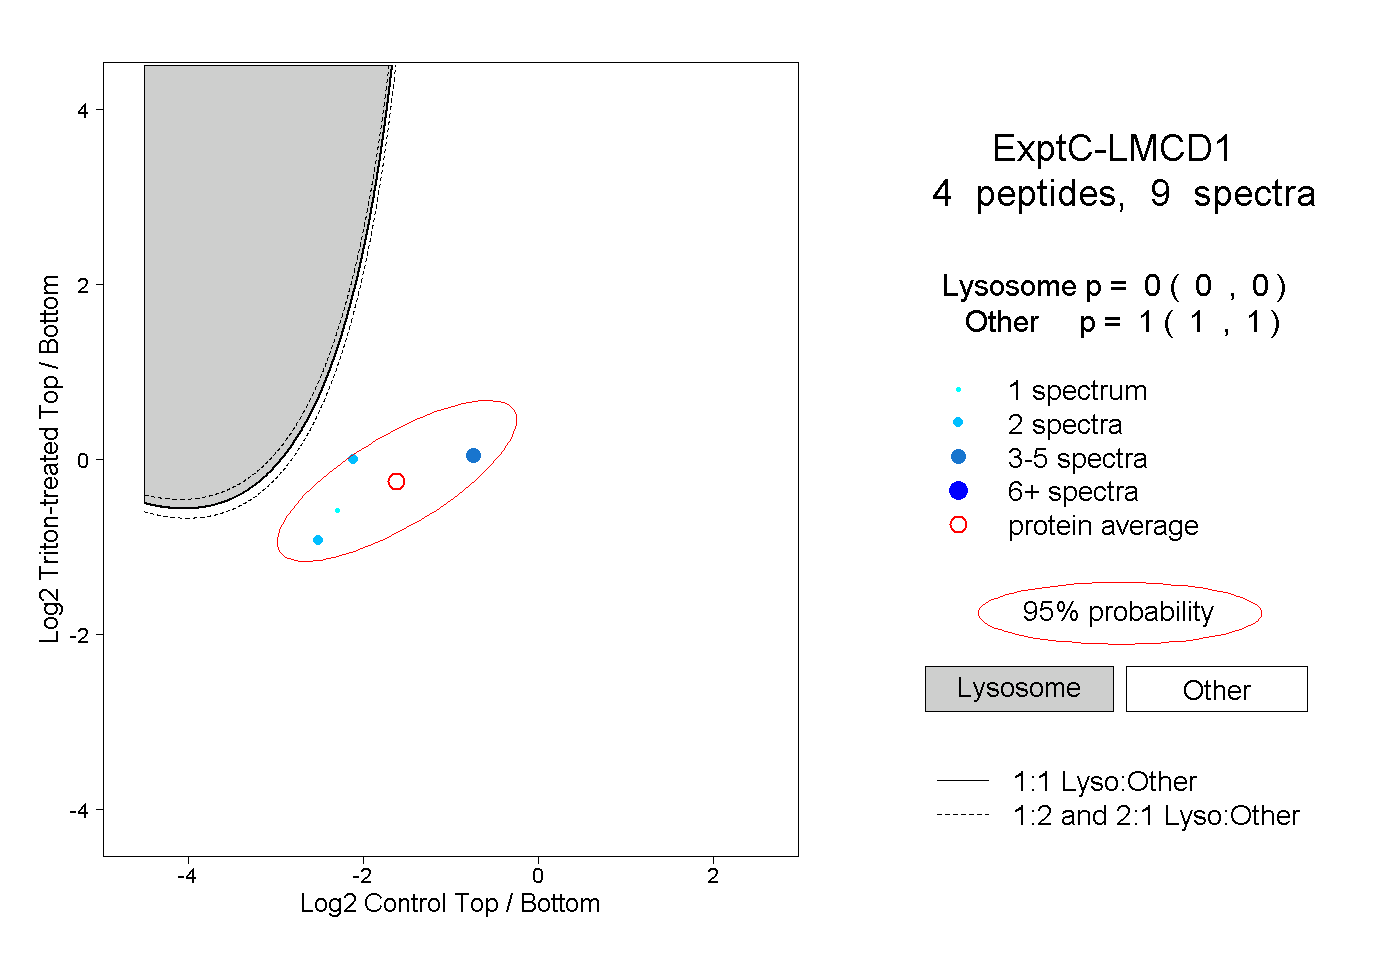 |
0.000 0.000 | 0.000 |
1.000 1.000 | 1.000 |