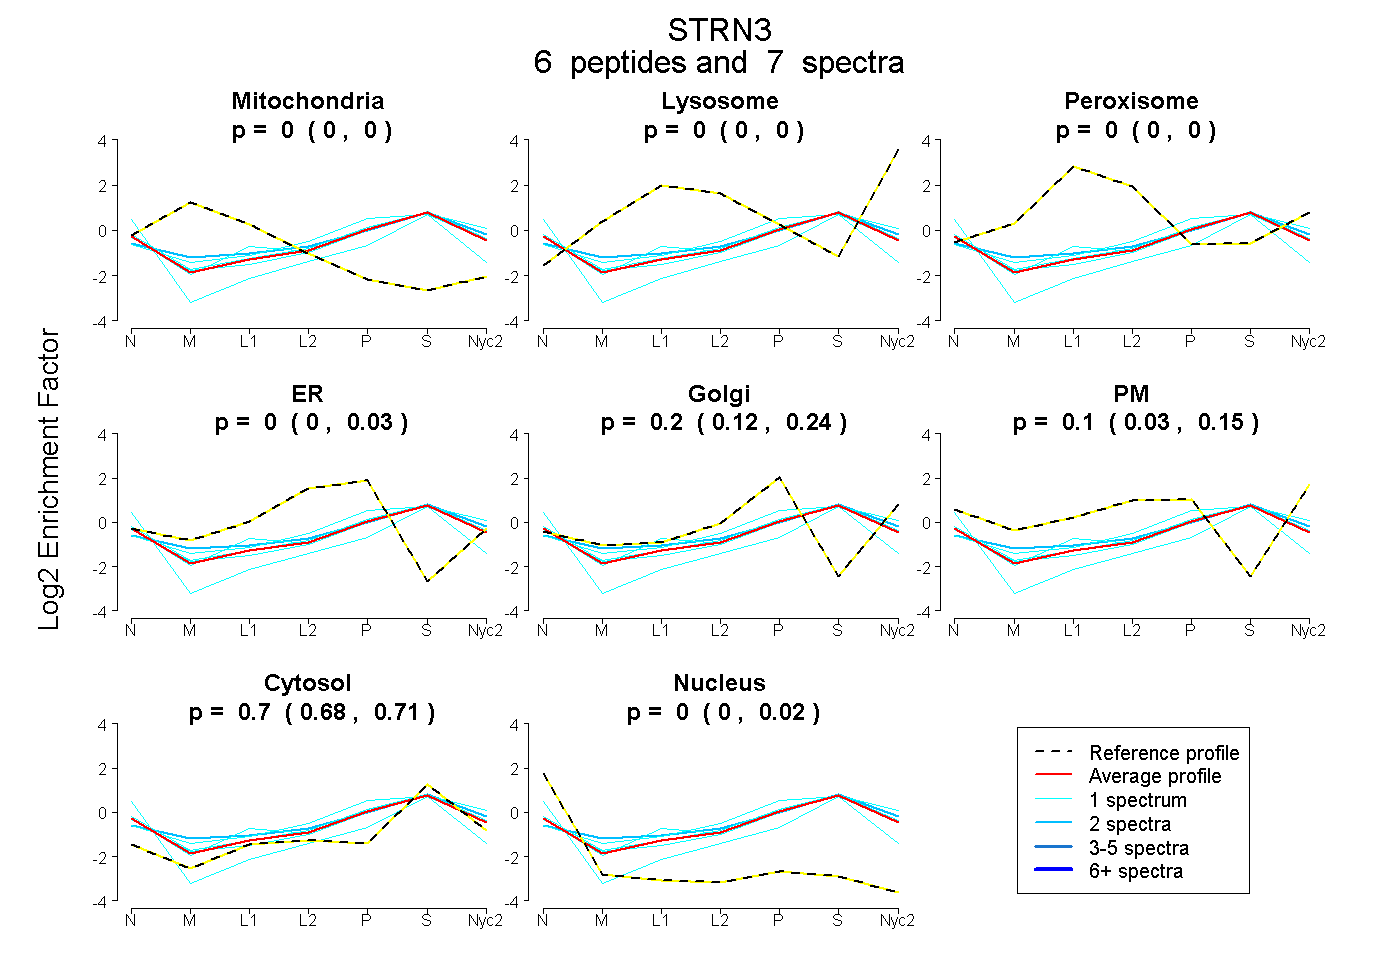
 6
6peptides
spectra
0.000 | 0.000
0.000 | 0.000
0.000 | 0.000
0.000 | 0.033
0.124 | 0.244
0.032 | 0.147
0.684 | 0.714
0.000 | 0.017
| Plot | Mito | Lyso | Perox | ER | Golgi | PM | Cytosol | Nucleus | |||||
| Expt A |
6 peptides |
7 spectra |
|
0.000 0.000 | 0.000 |
0.000 0.000 | 0.000 |
0.000 0.000 | 0.000 |
0.000 0.000 | 0.033 |
0.197 0.124 | 0.244 |
0.099 0.032 | 0.147 |
0.702 0.684 | 0.714 |
0.003 0.000 | 0.017 |
| 1 spectrum, AYIASAGADALAK | 0.000 | 0.000 | 0.000 | 0.000 | 0.078 | 0.000 | 0.689 | 0.233 | ||
| 2 spectra, AHWEVER | 0.000 | 0.000 | 0.081 | 0.000 | 0.192 | 0.086 | 0.641 | 0.000 | ||
| 1 spectrum, YGTELNQGDLK | 0.000 | 0.000 | 0.000 | 0.000 | 0.150 | 0.194 | 0.656 | 0.000 | ||
| 1 spectrum, LWNPQEK | 0.000 | 0.000 | 0.000 | 0.000 | 0.237 | 0.054 | 0.710 | 0.000 | ||
| 1 spectrum, SHFDGVR | 0.000 | 0.000 | 0.037 | 0.108 | 0.252 | 0.000 | 0.603 | 0.000 | ||
| 1 spectrum, SASLDVEPIYTFR | 0.000 | 0.000 | 0.046 | 0.000 | 0.181 | 0.095 | 0.678 | 0.000 |
| Plot | Lyso | Other | |||||||||||
| Expt C |
5 peptides |
6 spectra |
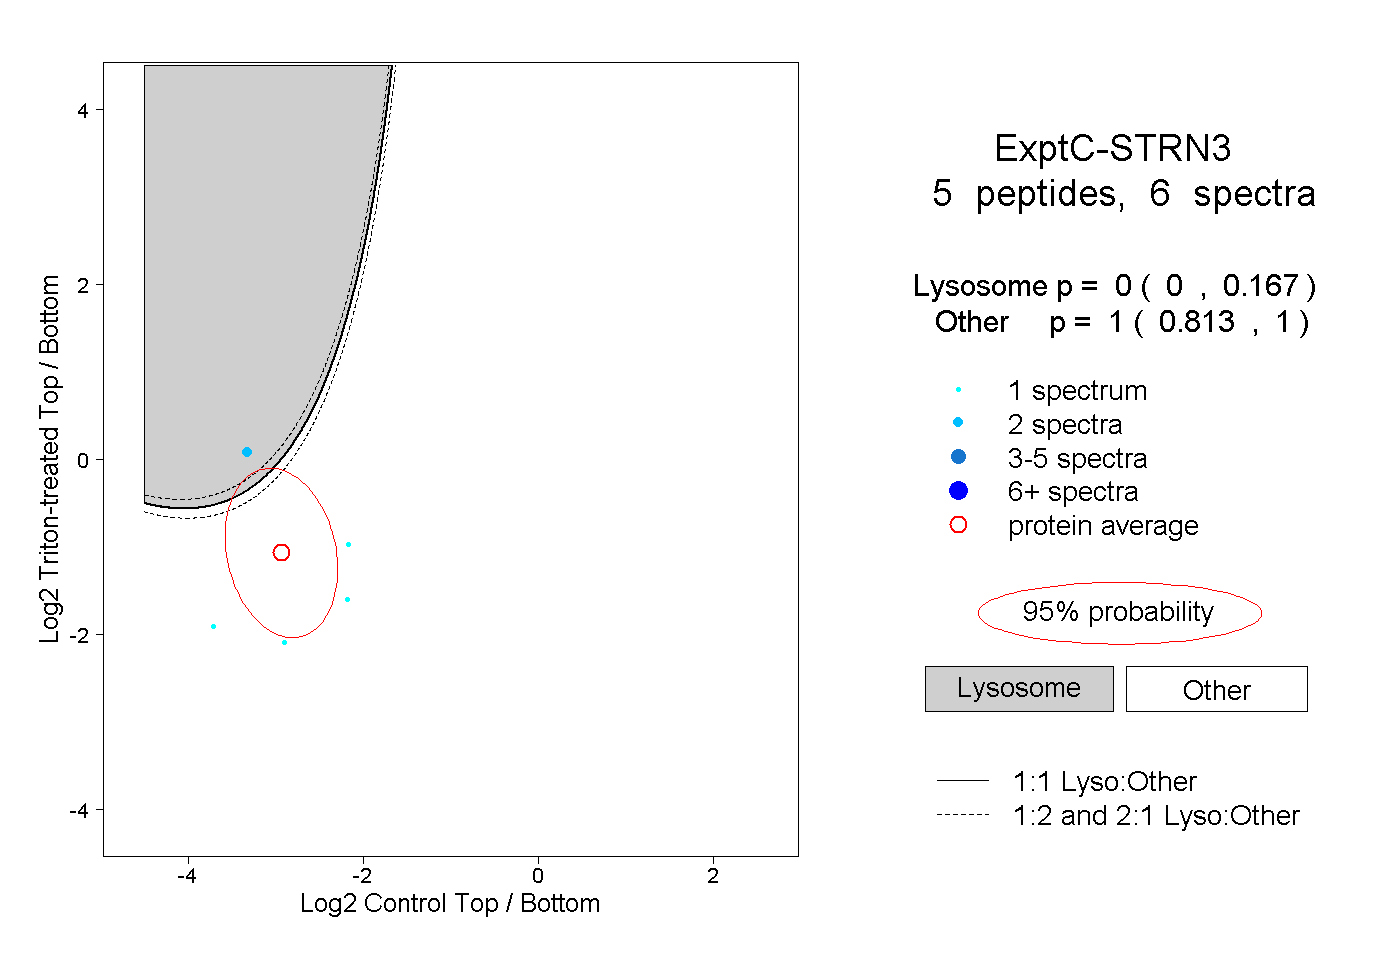 |
0.000 0.000 | 0.167 |
1.000 0.813 | 1.000 |
||||||||
| Plot | Lyso | Other | |||||||||||
| Expt D |
1 peptide |
1 spectrum |
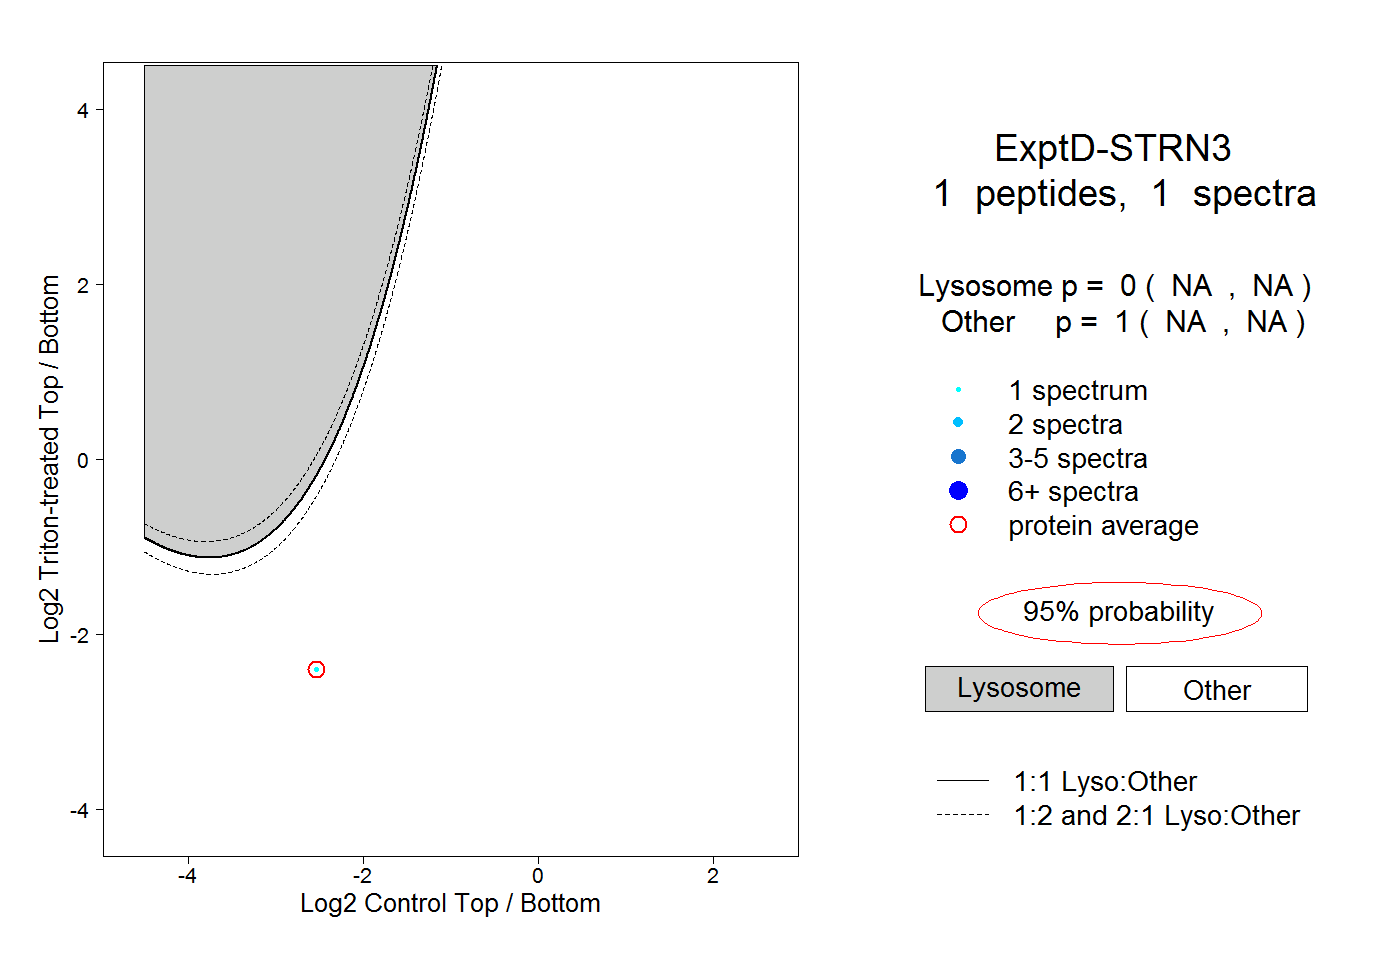 |
0.000 NA | NA |
1.000 NA | NA |