 4
4peptides
spectra
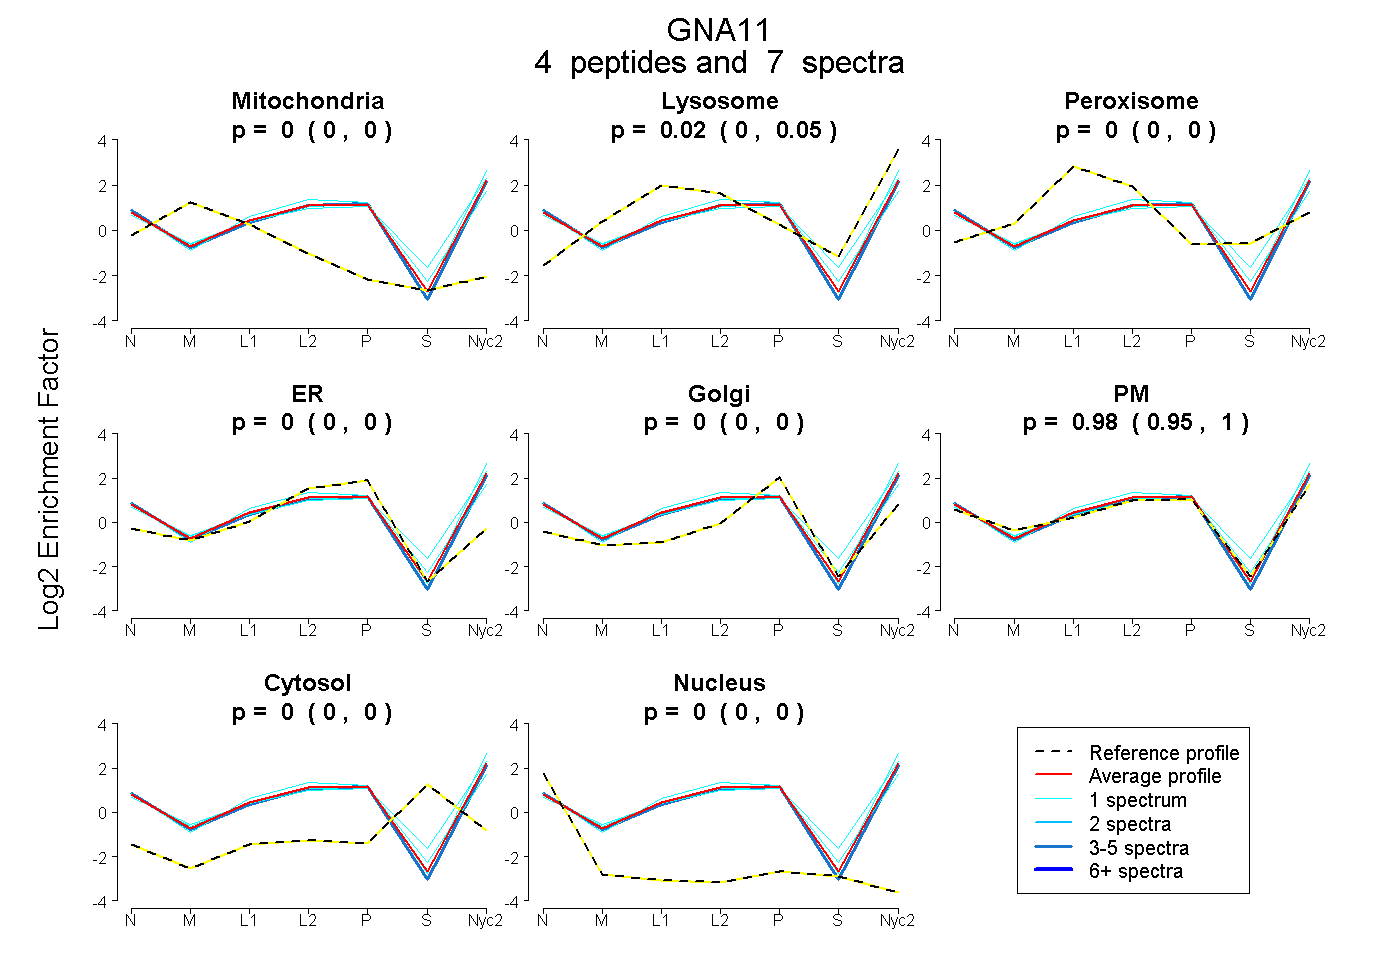
0.000 | 0.000
0.000 | 0.046
0.000 | 0.000
0.000 | 0.000
0.000 | 0.000
0.949 | 1.000
0.000 | 0.000
0.000 | 0.000
3peptides
spectra
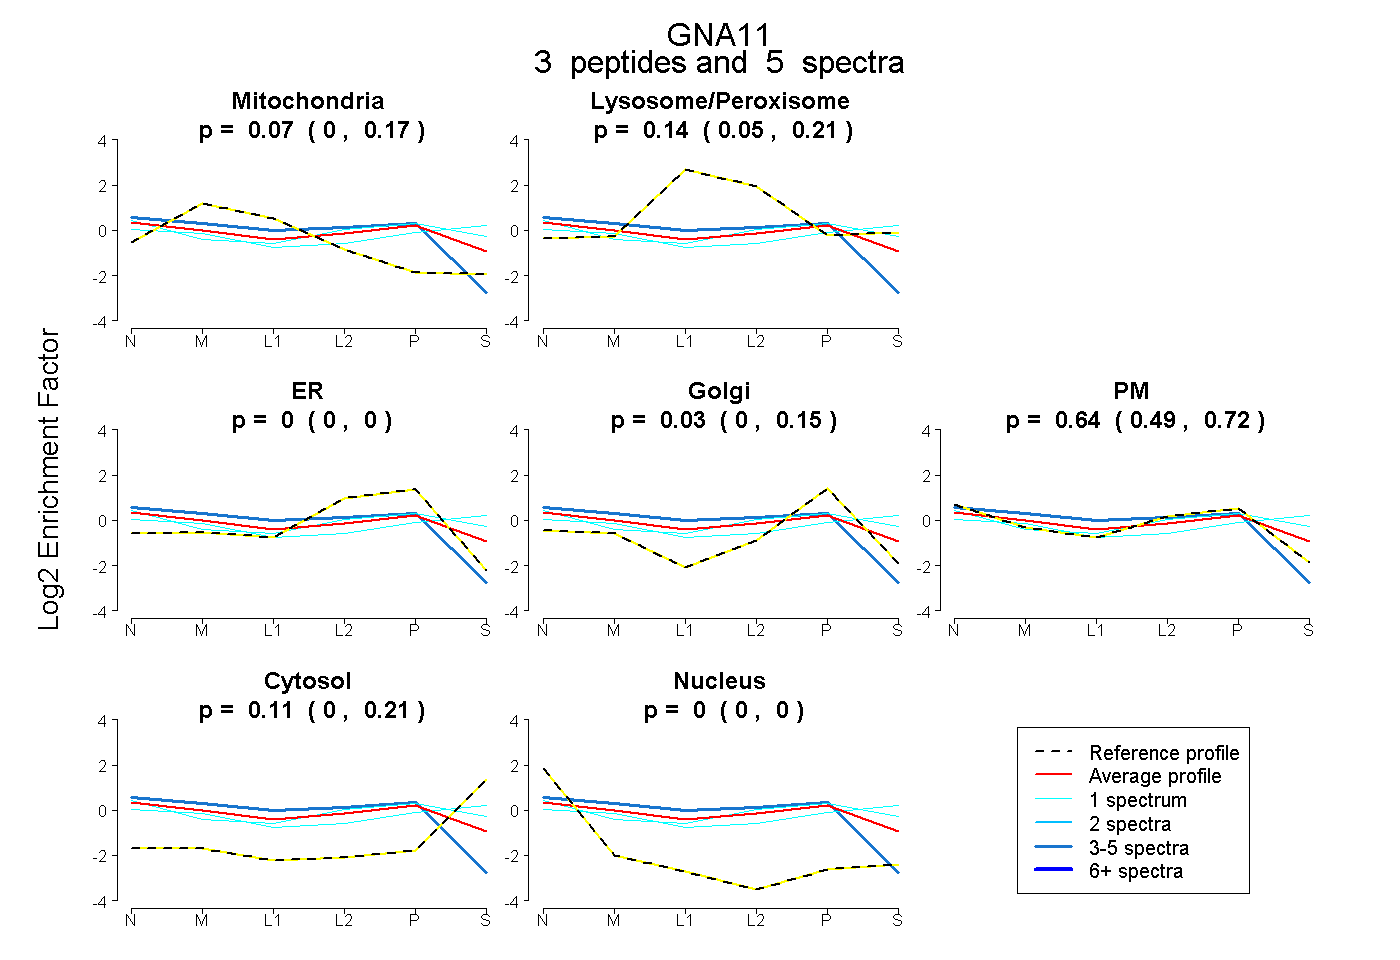
0.000 | 0.174
0.050 | 0.212
0.000 | 0.000
0.000 | 0.148
0.489 | 0.717
0.000 | 0.206
0.000 | 0.005
12peptides
spectra
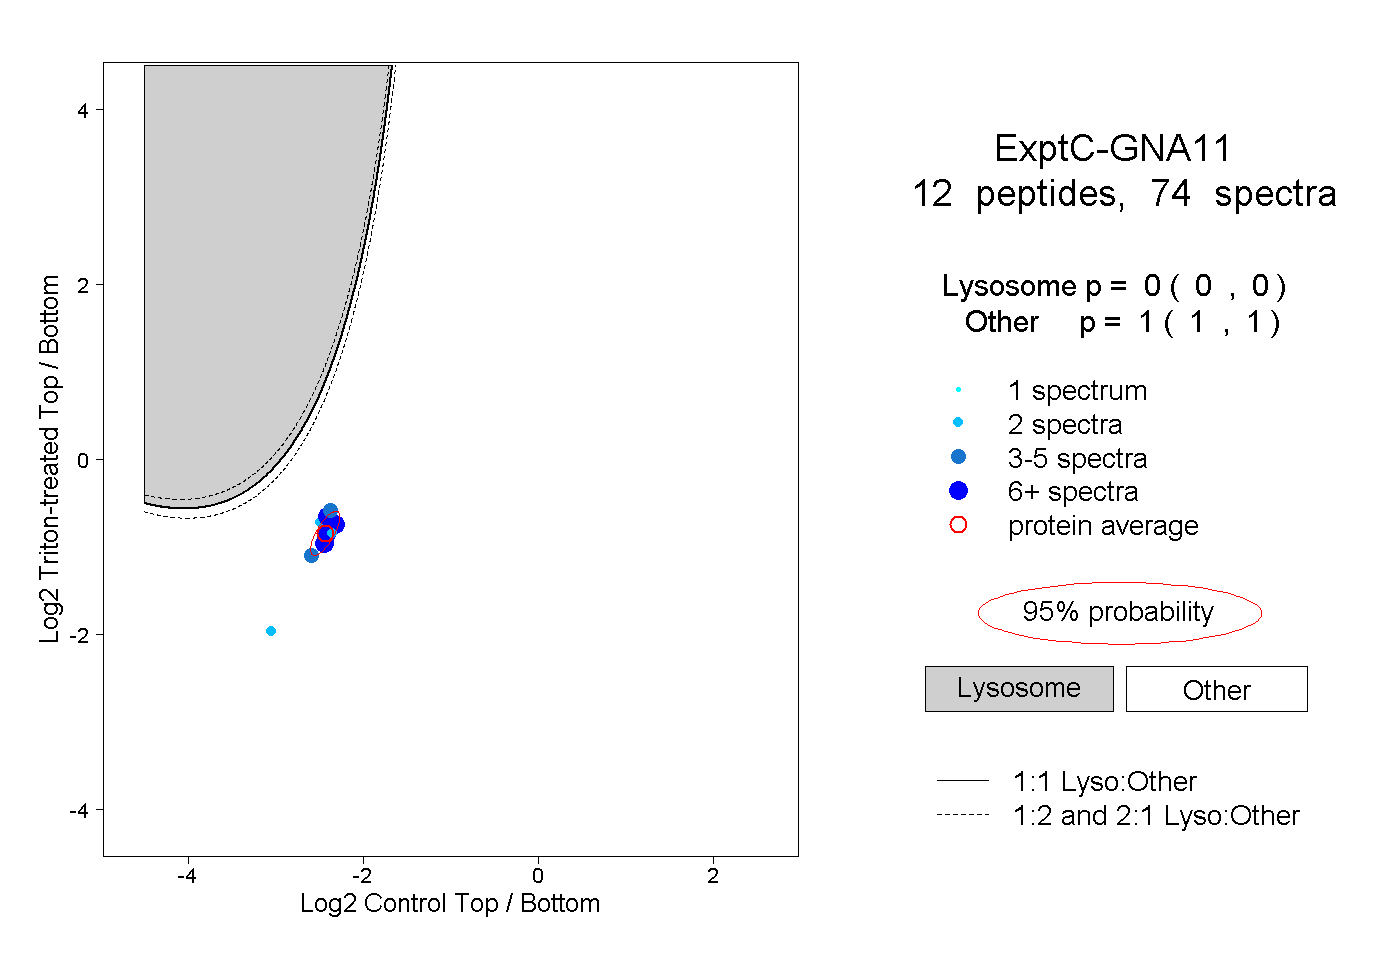
0.000 | 0.000
1.000 | 1.000
3peptides
spectra
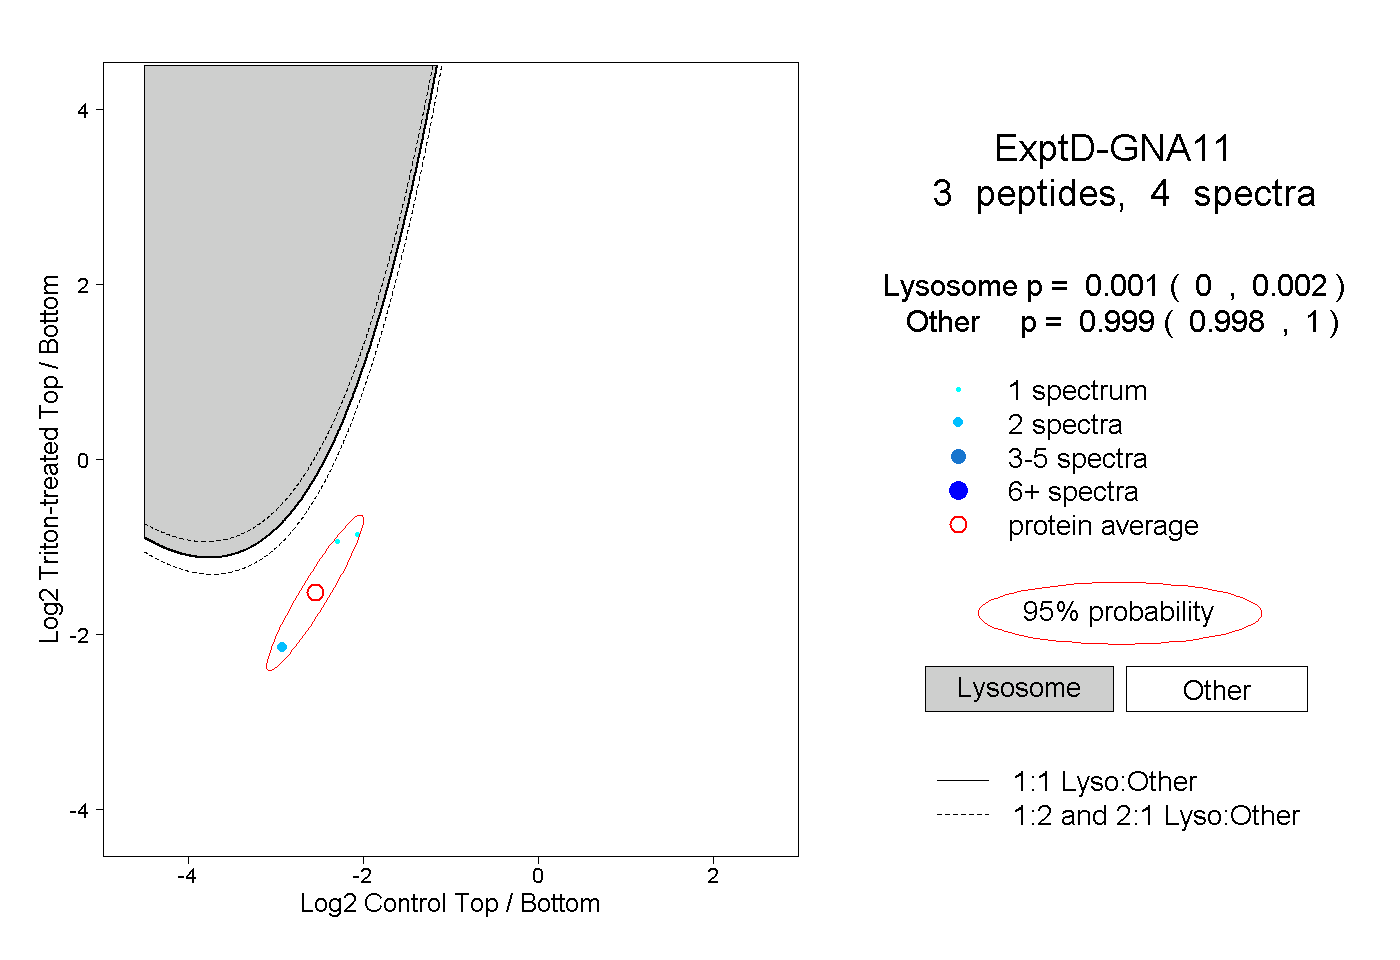
0.000 | 0.002
0.998 | 1.000